Updated: October 17, 2024
As a host, staying up-to-date with the local market can seem like a daunting task. Whether you’re looking at how your property stacks up against others or scouting new investment opportunities, the sea of data and charts can easily become overwhelming.
At PriceLabs, we have been using AI for our price recommendations for many years now. From collecting data from multiple sources to analyzing it to find patterns, our algorithm does all the hard work for you. We also help you understand why our algorithm has made a pricing decision, by providing market trends around your property as charts in our Neighborhood Data feature.
Inspired by the popularity of ChatGPT in different sectors, we explored how we could leverage it on top of our robust algorithm. Our aim was to simplify market analysis for you. That’s when we launched AI Insights, a feature that lets you convert charts into easy-to-understand sentences. Now, we have extended AI Insights to other tools and also made refining market reports much easier.
Keep reading to discover how our AI enhancements can bring more value to your PriceLabs experience.
Turn Charts Into Easy-To-Understand Sentences
As a host, it’s important to know how your listing compares to the local market and competitors. What are the future trends for rates and occupancy? This is where PriceLabs’ Neighborhood Data can help.
We’ve always provided detailed information via charts, for each listing within Neighborhood Data, allowing you to:
- See future local market occupancy and rates
- Gain insights into average nightly rates and booking windows
- Dig deeper into competitors and even visit their listings
For some hosts, these charts can be hard to understand, especially if they do not analyze them often. It may take time to spot trends, future price surges, or more. With AI Insights, we’ve simplified the process, making it quicker and easier to understand the Future Prices and Future Occupancy charts.
With AI Insights, you can:
- Turn data-heavy charts into simple sentences
- Summarize market trends for each listing
Suggested Read: Learn more about AI Insights in Neighborhood Data
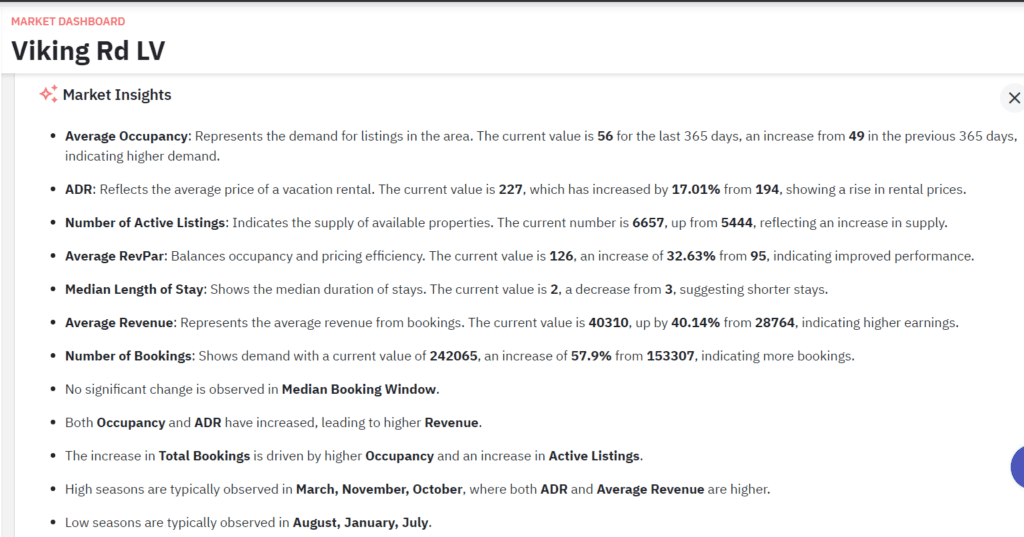
You may also want to get a broader overview of the market, whether to spot future trends, understand seasonal variations, or identify new investment opportunities. PriceLabs’ Market Dashboards give you a comprehensive view of any market worldwide.
With Market Dashboards, you can:
- Understand expected revenue and nightly rate
- Discover the popular amenities in the market
- Learn about typical booking windows and stay durations
Similar to Neighborhood Data, now Market Dashboards are also equipped with AI Insights. You no longer have to be a revenue management expert to gauge new markets. You can now turn these market-data charts into simple sentences.
AI Insights in Market Dashboards:
- Gives you a summary of all the key insights and trends
- Saves time to go through each metric separately
Suggested Read: Learn more about AI in Market Dashboards
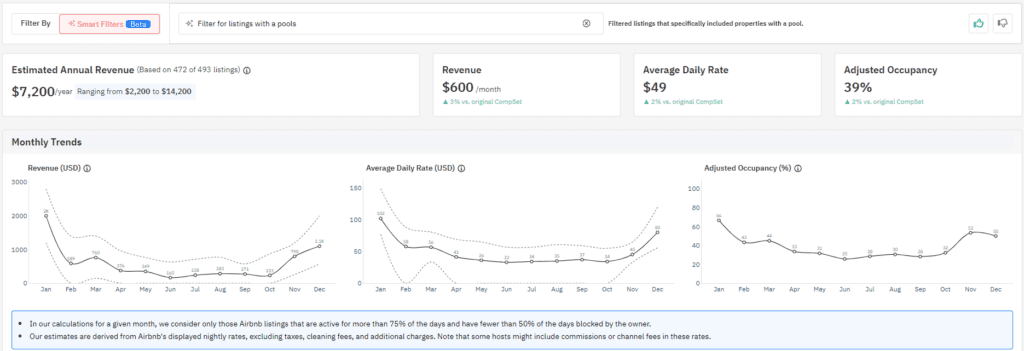
Refine Market Data With Smart Filtering
When analyzing broader markets, selecting relevant competitors is crucial. For instance, if you’re investing in a property with a pool, you’d want to see how other similar properties with pools are performing. General market data alone can be misleading. That’s why refining the dataset to focus on properties that match your specific needs is essential.
We’ve made it easier to further refine reports beyond what our Market Dashboard and Revenue Estimator Pro offer. Now, you can fine-tune the reports by simply entering the metric or value you want the tool to analyze.
With these features, you can:
- Get precise estimates using Revenue Estimator Pro
- Identify trends specific to your segment of the market
- Account for your property’s uniqueness to access the most relevant data
Suggested Read: Learn more about filtering in Revenue Estimator Pro
Try these features today and see how market analysis has become easier than ever before!