
Key Takeaways
The provided dataset sourced from the Short-term Rental Worldwide Index for Andalusia, Spain, shows a seasonal fluctuation in most categories.
- Average Daily Rate (ADR) and Revenue Per Available Room (RevPAR) have their highest values during the summer months, peaking each year in July or August (highest ADR in 2023_08 at 190€, highest RevPAR in 2023_07 at 110€) while having the lowest values in the early part of the year (lowest ADR in 2021_02 at 98€, lowest RevPAR in 2021_01 and 2021_02 at 16€).
- The occupancy rate has a similar trend, with the highest rate (71%) recorded in August 2022 and the lowest rate (16%) in February 2021.
- The average monthly bookings vary less dramatically throughout the year, ranging from 0.9 to 3.3.
- There’s been a steady increase in the count of active listings across the period, from 63,248 listings in January 2021 up to 99,781 listings in September 2023, indicating an upward trend in the availability of accommodation options.
- Overall, the data shows an evident seasonality in short-term rental performance in Andalusia, Spain, with summer being the most lucrative period for the accommodation industry.
ADR Summary

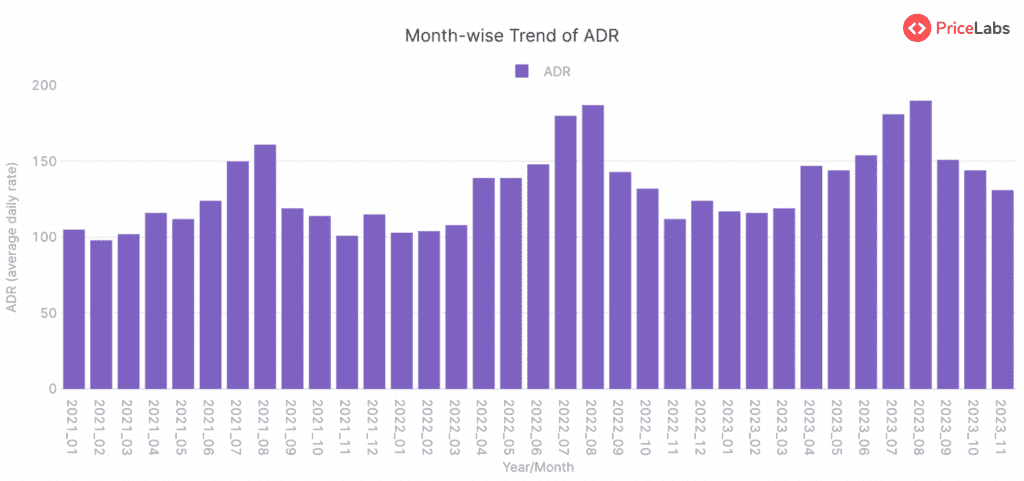
The Average Daily Rate (ADR) for Andalusia, Spain, appeared to follow a seasonal trend from January 2021 to November 2023, according to the given data. Each year starts with 3 months of relatively low ADR values: 105€, 98€ and 102€ in the first quarter of 2021, these gradually increased up to a peak of 161€ in August 2021. The ADR then declined to 101€ in November before rising slightly in December to 115€. This pattern repeats in subsequent years like in 2022, starting from 103€ in January and peaking at 187€ in August, then dropping to 112€ in November, followed by an increase to 124€ in December. In 2023, the pattern is observed once again, with ADR starting at 117€ in January, with another peak in August at 190€ and coming down to 131€ in November. Thus, it can be inferred that the ADR has been consistently highest in summers (particularly in August) and lowest towards the end of the year, especially in November.
RevPAR Summary
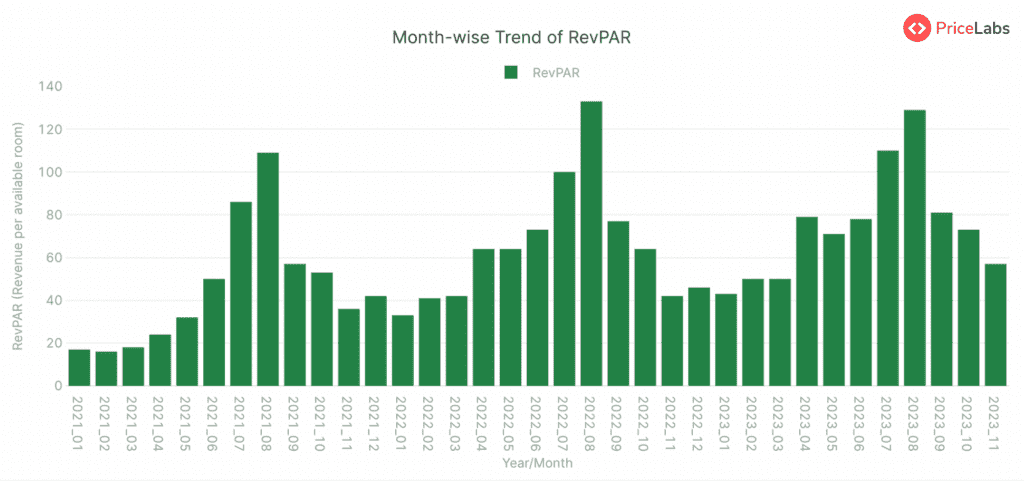
The RevPAR in Andalusia, Spain, from 2021 to 2023 has shown a general upward trend with observable seasonality. Starting at 17€ in January 2021, it hovered mostly around the teens to low twenties until April 2021, when it increased to 24€. The RevPAR then steadily climbed, peaking during the summer months of each year – in 2021, reaching a high of 109€ in August; in 2022, reaching 133€ in August; and in 2023, reaching 129€ in August. The RevPAR then would dip slightly in September before a further declining trend in the fall and winter months, making a low in February (16€ in 2021, 41€ in 2022, 50€ in 2023). Following this, the RevPAR would rise again heading into the spring and summer months, showcasing a clear pattern of seasonality.
Read here: How to Calculate RevPAR.
Occupancy Rate Summary
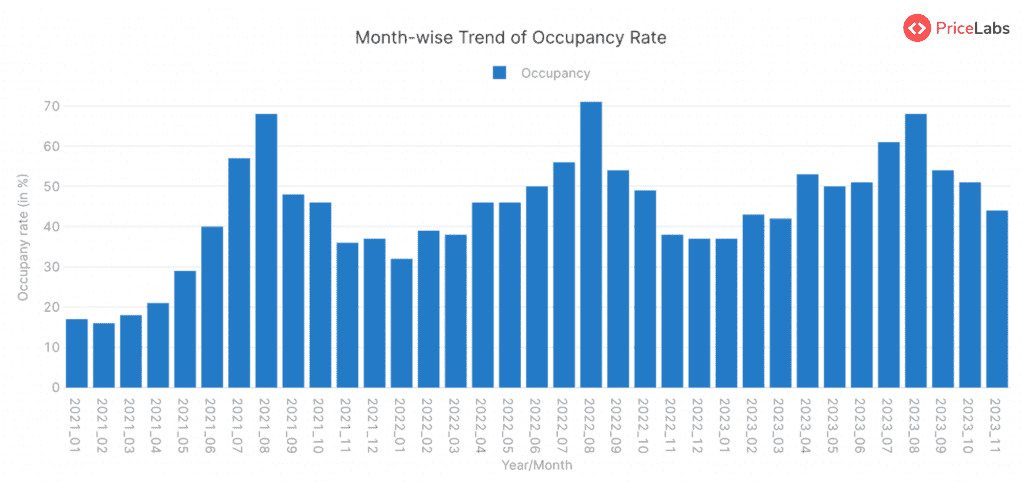
Occupancy in Andalusia, Spain, has seen an overall upward trend across the analyzed period from January 2021 to November 2023, showing a general growth in occupancy rates. At the start of the year 2021, occupancy was at 17%, and it subsequently increased, peaking in August of both 2021 and 2022 with 68% and 71%, respectively, indicating a seasonal trend for summer months.
Simultaneously, a slight dip was noticed in the occupancy rate in the fall season for both 2021 and 2022, the lowest in 2021 at 16% in February and in November of 2022 and 2023 at 38%. This suggests reduced occupancy during the fall and winter months.
By the end of the year 2023, the occupancy was reported at 44% in November, demonstrating a significant improvement compared to the corresponding period in previous years. Over these years, occupancy rates have gradually increased from 17% to 44%, with a steady upward trend despite occasional seasonal declines. This overall increase signified the strengthening of the hospitality sector in the region.
Read here: How to Calculate Occupancy Rate.
Avg. Bookings Summary
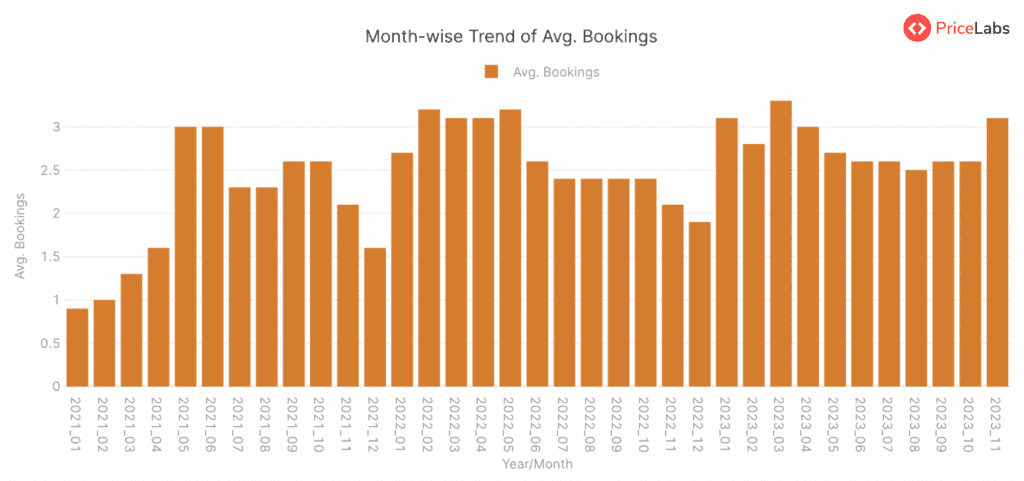
The average bookings for Andalusia, Spain, showed an overall increase from January 2021 to November 2023. Notably, the number of average bookings increased during the spring and summer months, indicating a seasonal trend towards higher booking rates during warmer seasons.
In January 2021, the average bookings were at 0.9. This slightly increased in February and March, to 1.0 and 1.3, respectively. The figure peaked in April at 1.6 and continued to increase in May and June, where it reached 3.0. This suggests that the late spring and early summer period saw the highest number of average bookings.
The number slightly declined to 2.3 in July and August but again increased in September and October to 2.6. It seems the fluctuations in average bookings became less pronounced towards the end of the year, settling in a range between 1.6 and 2.7 till January 2022.
The average bookings in 2022 started at 2.7 in January, peaked at 3.2 in February and May, and then hovered around 2.4 to 3.2 till October. There was a slight dip in November and December, where the average bookings slipped to 2.1 and 1.9, respectively.
In 2023, on the other hand, the average bookings were 3.1 in January, reduced to 2.8 in February, and again peaked at 3.3 in March. The metric remained fairly stable from April to October, fluctuating between 2.6 and 3.0, then increased to 3.1 in November.
Overall, the average bookings in Andalusia, Spain, showed a seasonal pattern, with peaks in spring to early summer and dips in winter months. It is also evident that over the years the average bookings have been gradually increasing.
Count of Active Listings Summary
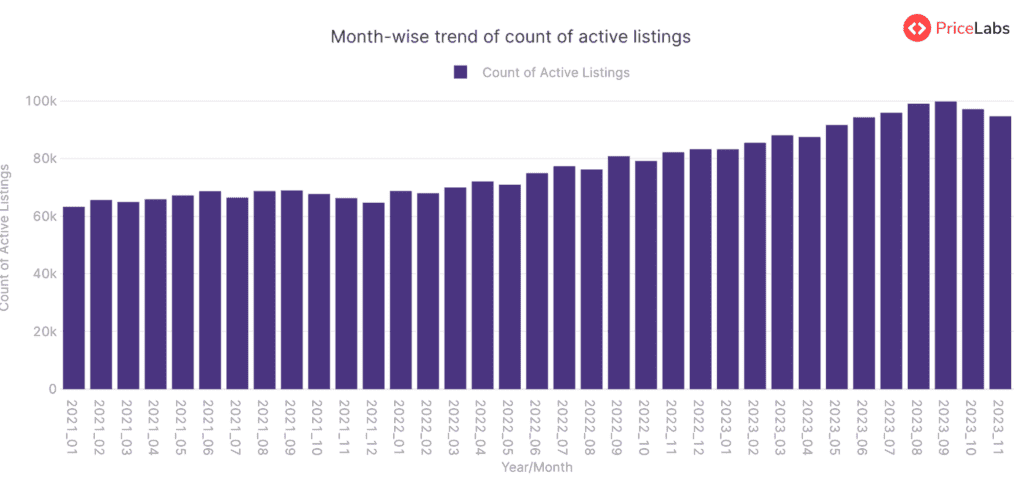
The count of active listings in the Andalusia region of Spain has shown a general upward trend over the period represented in the data, from January 2021 to November 2023. More specifically, the count increased from 63,248 in January 2021 to 94,681 in November 2023, with a few ups and downs along the way. Notably, there was a slight dip in the count in July 2021, followed by a significant increase to a peak in September 2021. However, the count dropped slightly in October and November 2021 before returning and resuming an upward trajectory through 2022. After reaching another high in September 2023, the count pulled back slightly in the last two months of the period. Overall, despite short-term fluctuations, the long-term trend shows a significant increase in the count of active listings.
Get actionable market insights from PriceLabs’ Market Dashboards.
About Short-term Rental Index
The World STR (Short-term Rental) Index by PriceLabs is a free tool for tracking short-term rental market performance worldwide. It offers data from Airbnb markets worldwide, refreshed monthly. You can access free insights on which locations are gaining or losing popularity. Key features include:
- Compare: Compare year-over-year metrics like active listings, occupancy rates, RevPAR, and ADR.
- Trend: Visualize how metrics have changed over the past years.
- Pacing: Compare upcoming year metrics to the previous year for occupancy, ADR, and RevPAR.
Explore more FREE tools by PriceLabs here.
About PriceLabs
PriceLabs is a revenue management solution for the short-term rental and hospitality industry, founded in 2014 and headquartered in Chicago, IL. Our platform helps individual hosts and hospitality professionals optimize their pricing and revenue management, adapting to changing market trends and occupancy levels.
With dynamic pricing, automation rules, and customizations, we manage pricing and minimum-stay restrictions for any portfolio size, with prices automatically uploaded to preferred channels such as Airbnb, Vrbo, and 100+ property management and channel integrations.
Every day, we price over 300,000+ listings globally across 135+ countries, offering world-class tools like the Base Price Help and Minimum Stay Recommendation Engine. Choose PriceLabs to increase revenue and streamline pricing and revenue management. Sign up for a free trial at pricelabs.co today.