

According to the Australian Bureau of Statistics, there are about 10.9 million homes in Australia. Over the past year, Airbnb has seen a 25% increase in listings compared to the previous year. Australia now ranks 10th in the number of listings globally. In this article, we try to understand the Australian short-term rental market with the support of data.
Australia – A Booming STR Market
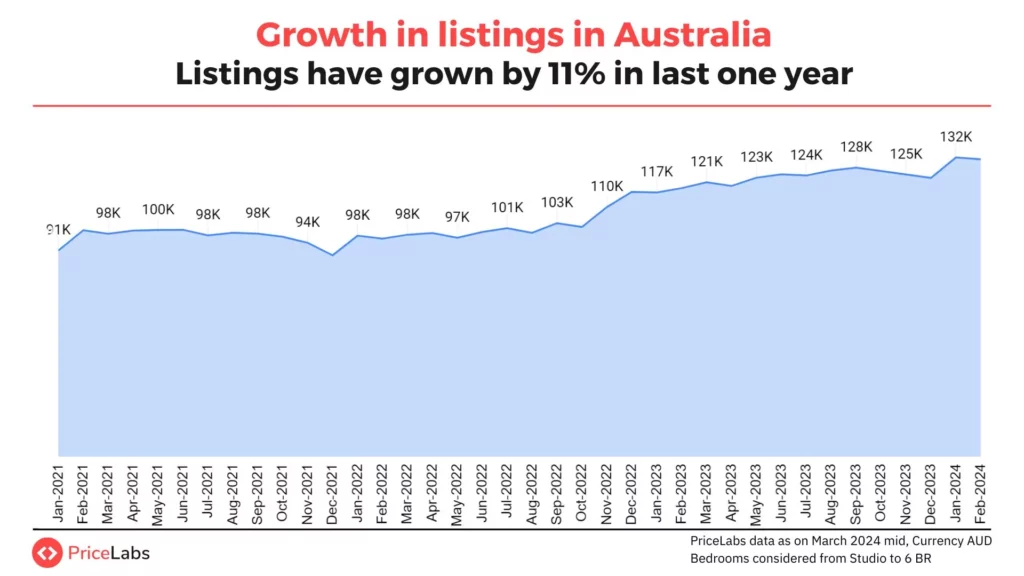
The Australian short-term rental market has demonstrated a consistent upward trajectory, with an 11% increase in the past year. In 2021, the market boasted approximately 121K listings, which has now risen to 132K. This represents a 45% increase in listing count, indicating a promising growth path for the Australian market.

Bonus Read: The Best Airbnb Amenities to Boost Your Occupancy Rate, ADR, and RevPAR
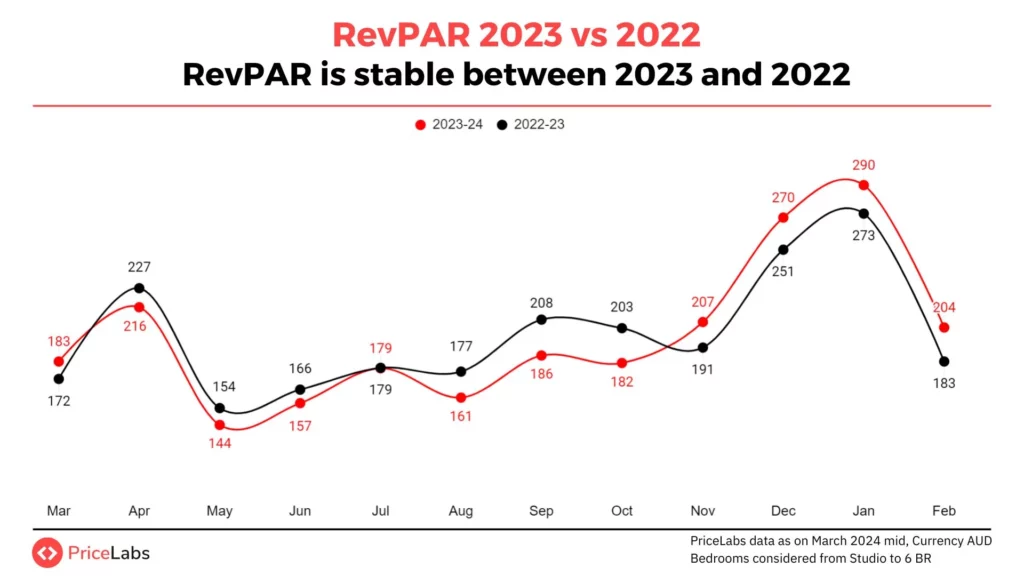
Stable Key Metrics
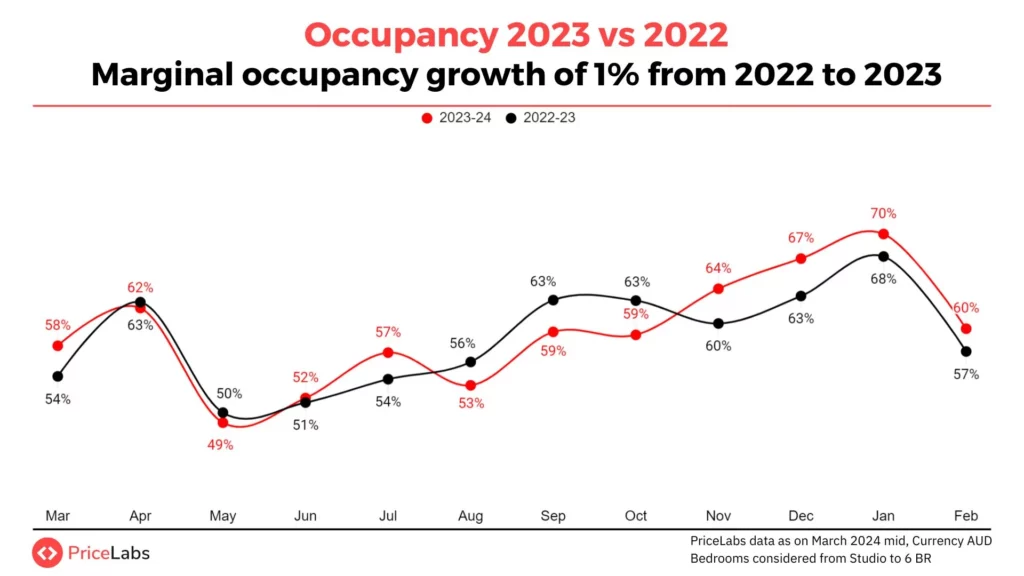
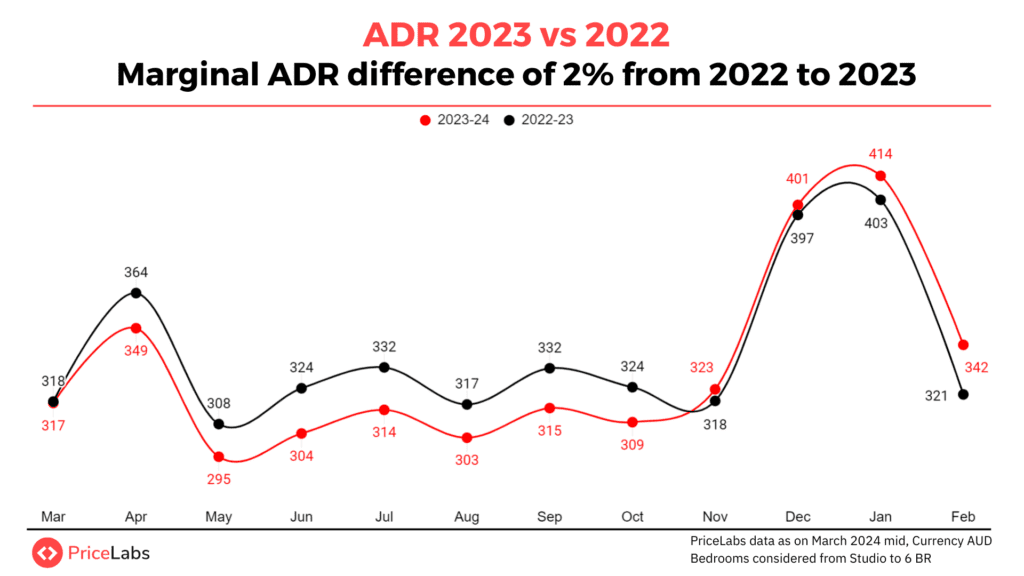
Despite an increase in the number of listings, key performance metrics remain stable. Comparing 2023 to 2022, we’ve seen marginal differences in metrics. The occupancy rate has seen a marginal growth of 1%. ADR has seen a de-growth of 2%, while RevPAR has remained stable.
Bonus Read: Revenue Management Strategies That Will Save You During the Economic Slowdown
Bonus Read: Strategies for Seasonal Pricing for Airbnb for high and low-season
Bonus Read: Airbnb SEO: Optimize Airbnb Listing for Maximum Visibility
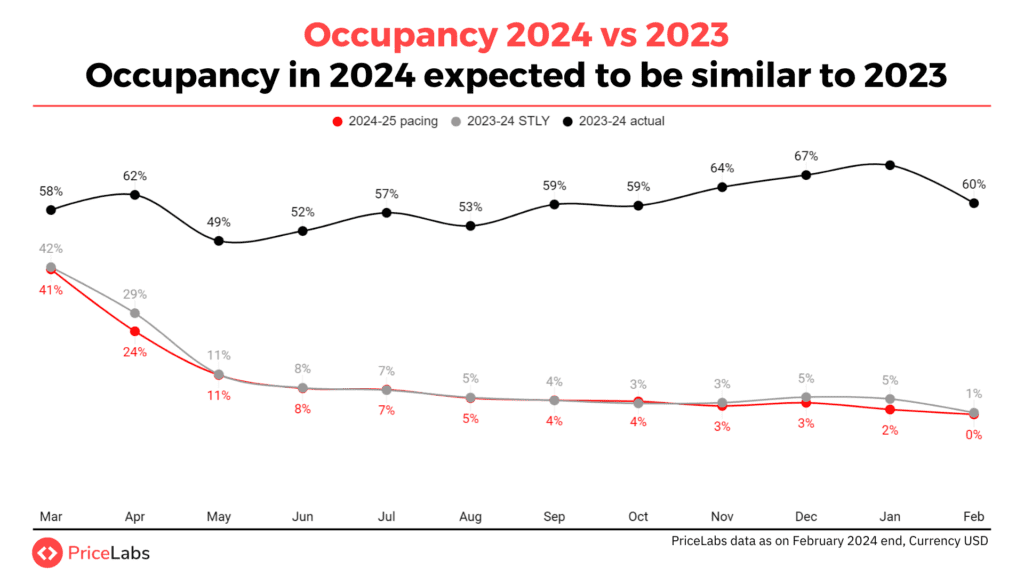
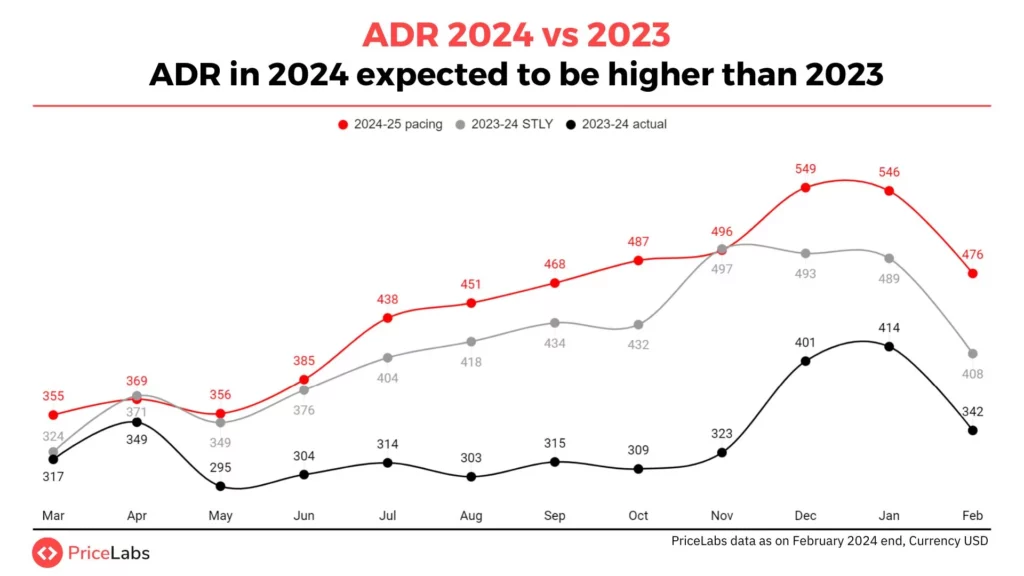
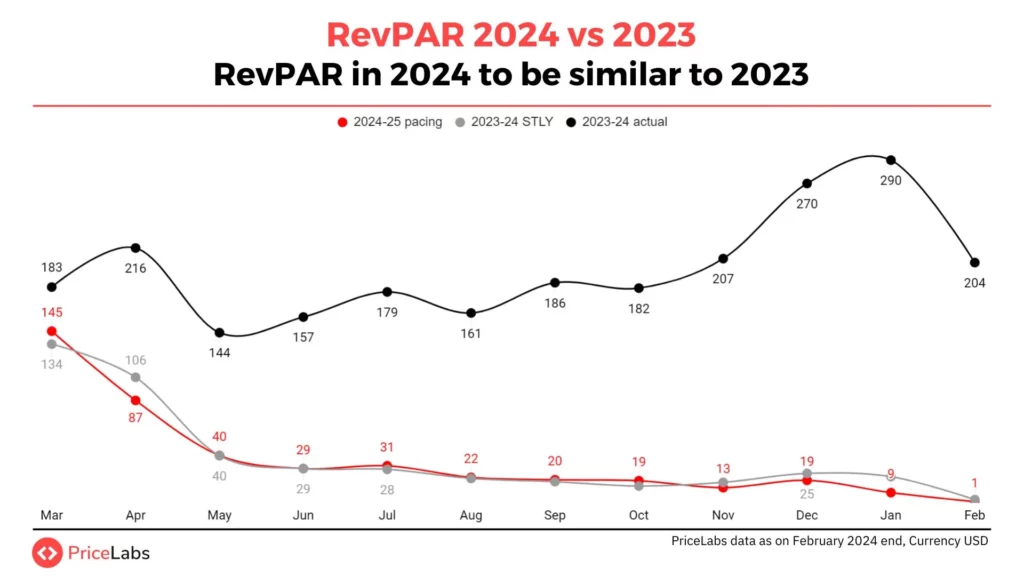
Future Trends: Metrics that drive 2024
This year seems normal and stable. Occupancy is expected to remain stable at around 60%. ADR, however, is supposed to increase to 476 from 342 in 2023. However, this increase in ADR might not mean an increase in revenue, as ADR is expected to remain stable again.
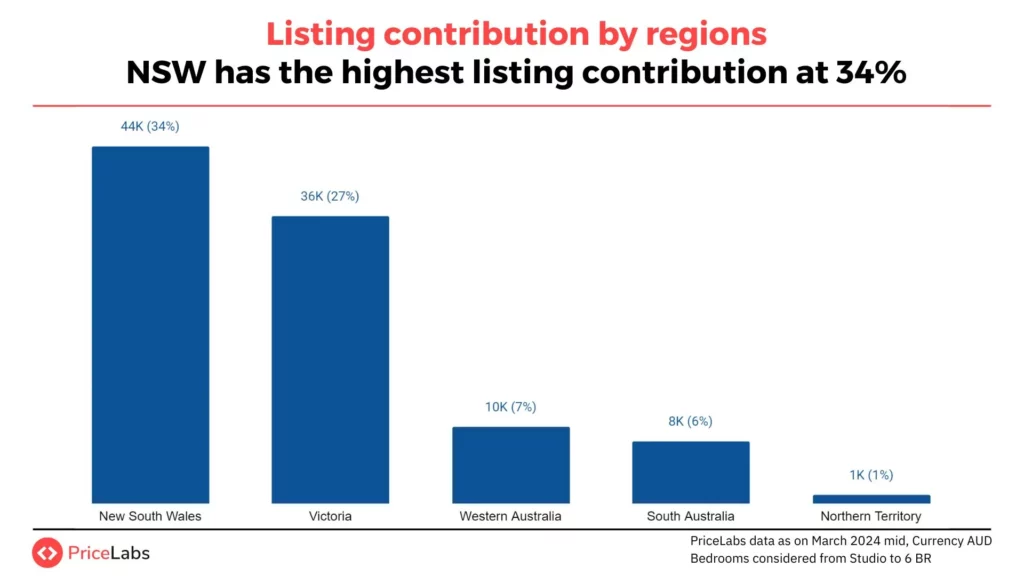
Listing contribution by region
New South Wales has the highest number of listings in the country, with about 44K listings in this Australian State. The lowest is the Northern Territory, with only about 1% of listings in that region. This makes sense as the Northern Territory’s population is comparatively lower than that of the other states in Australia.
Key Performance Metrics by Region
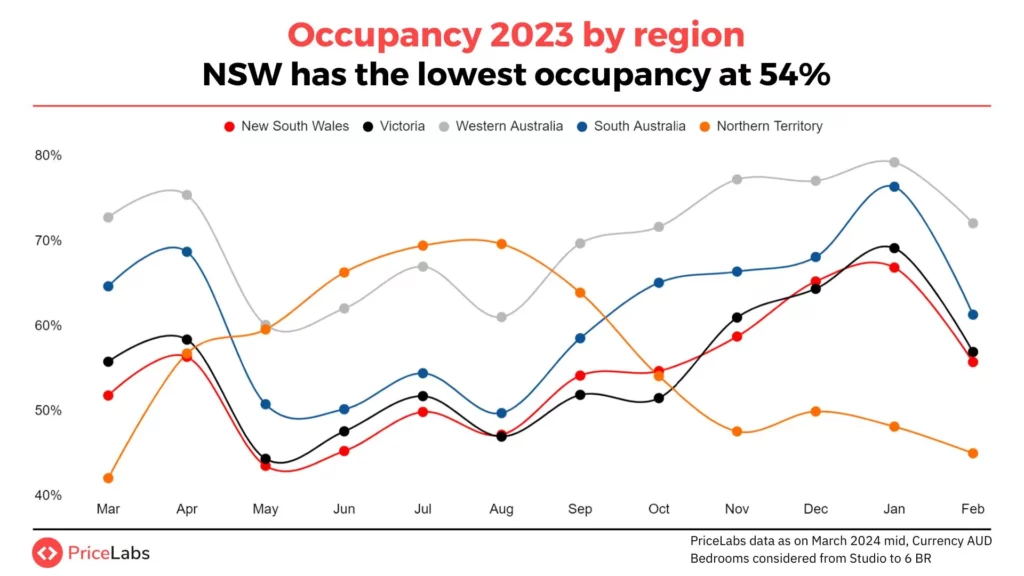
Occupancy
Even though New South Wales has the maximum number of listings, it has the lowest occupancy at about 54%. Western Australia has the highest occupancy at around 70%.
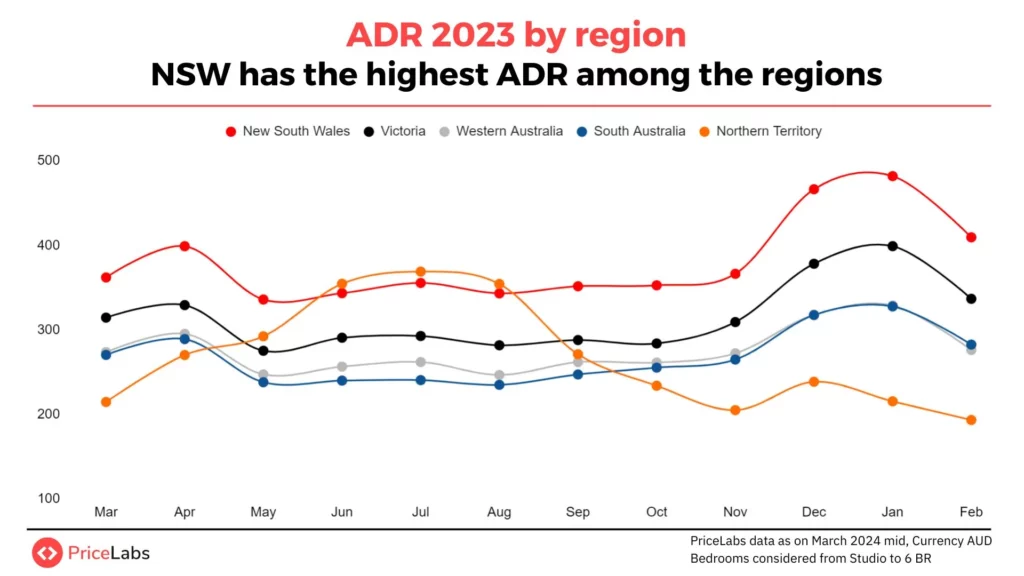
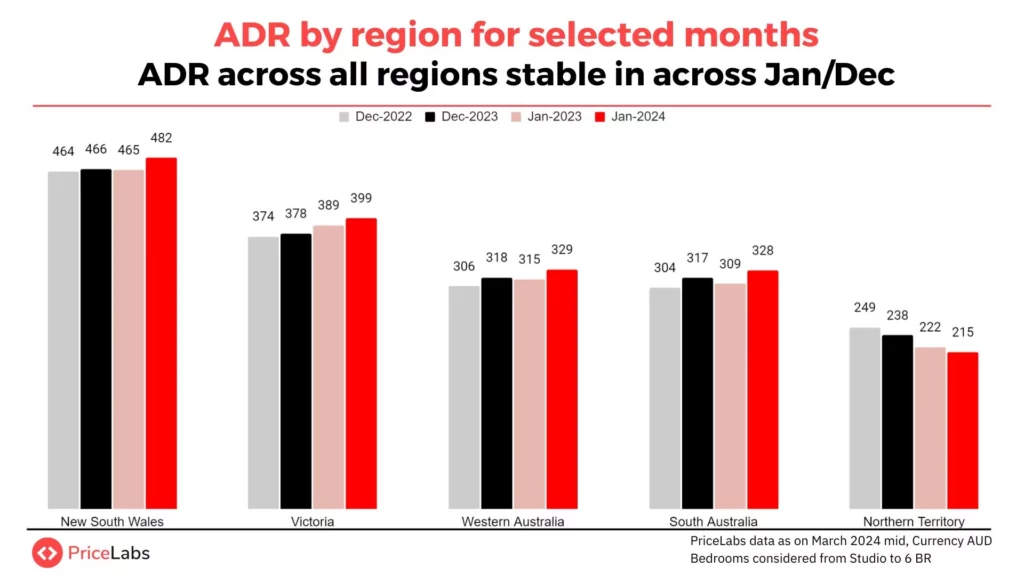
ADR
Even though occupancy is low, New South Wales boasts the highest ADR at around AUD 400 per night. Northern Territory is at the lowest at around AUD 200 per night.
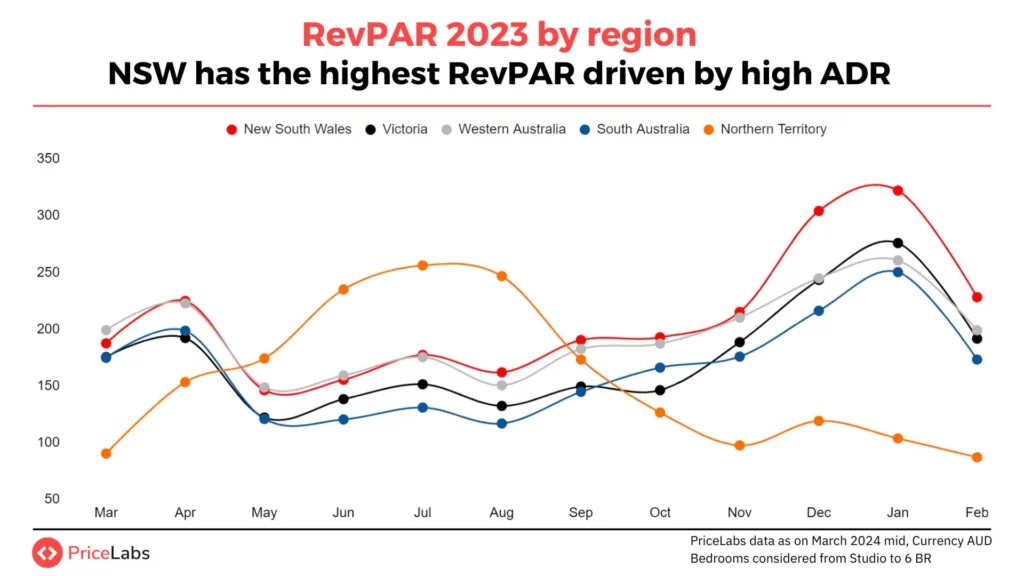
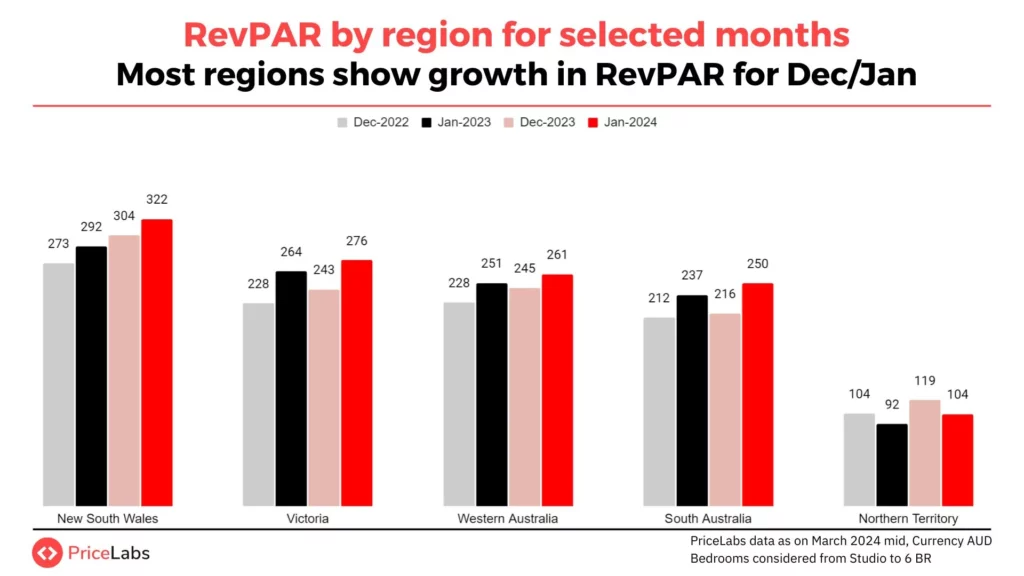
RevPAR
Driven by the high ADR, New South Wales has the highest RevPAR. The most interesting trend here is in the Northern Territory. If you look at its RevPAR from May to August, there’s a spike higher than the rest of the market. This trend dies down as we approach September. This spike may be attributed to the area’s general season and events that occur during that period.
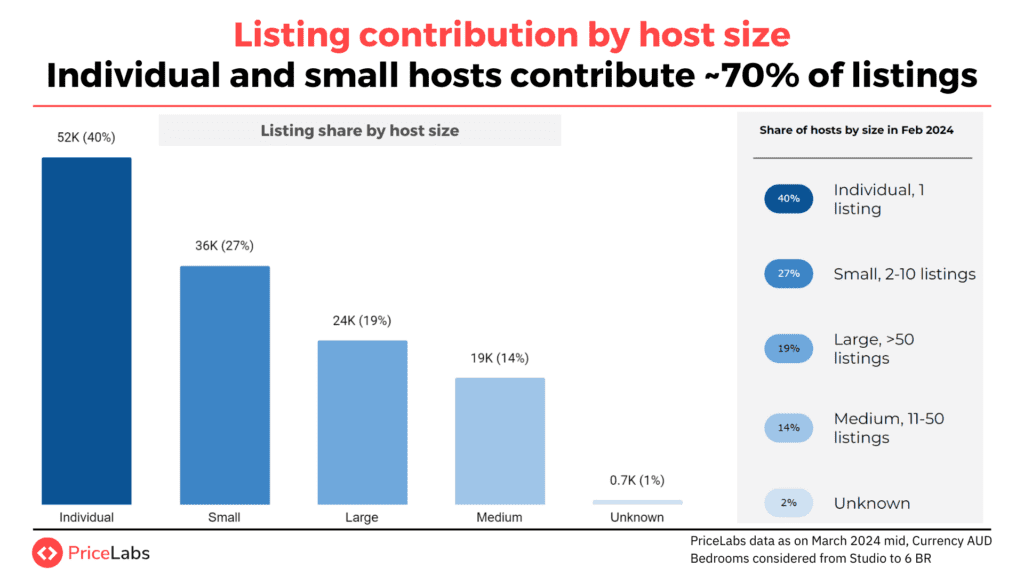
Listing Contribution by Host Size
The Australian short-term rental market is dominated by individual hosts with only ~1 listing. They make up about 40% of the market, and small hosts, with 2-10 listings in their portfolio, dominate 27% of the market.
The Impact of Dynamic Pricing on Listings’ Performance
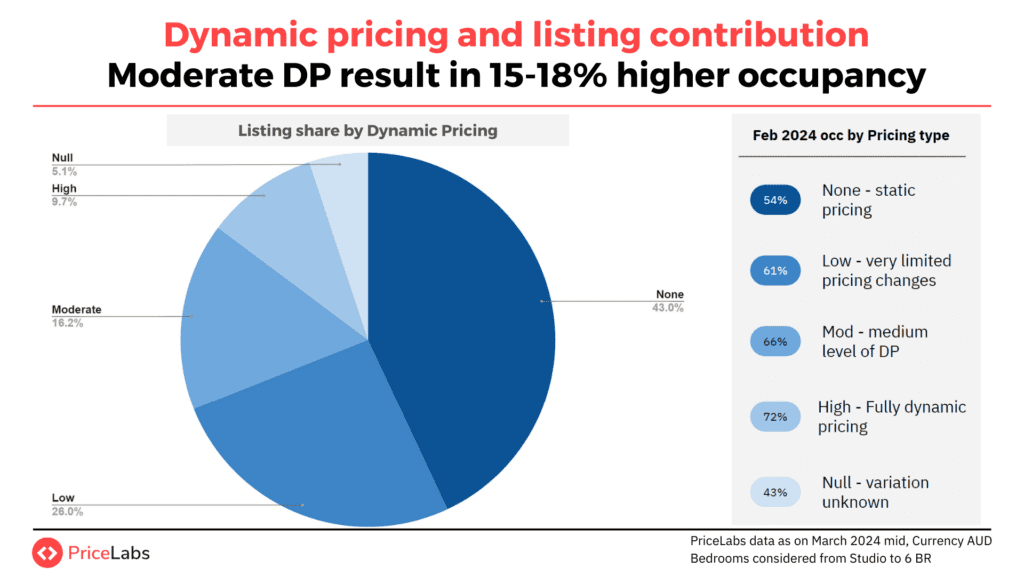
About 43% of the listings in Australia do not use Dynamic Pricing. Only 9% of the listings enable high dynamic pricing. About 42% of listings in Australia use either moderate or low dynamic pricing.
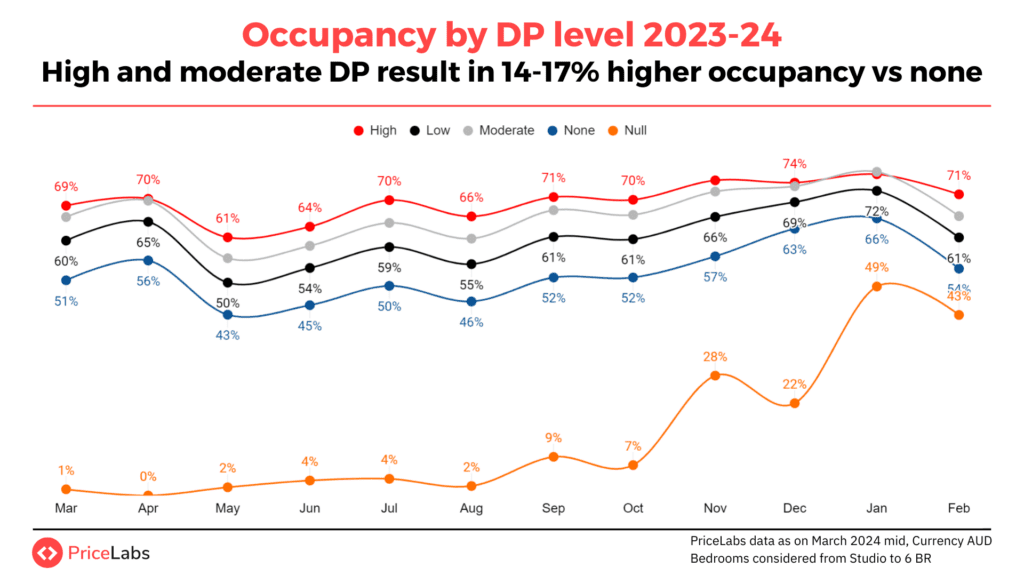
Occupancy
Listings that used high dynamic pricing or were fully dynamically priced saw an occupancy of 72% in February 2024. Those that did not use dynamic pricing and only used static pricing saw an occupancy rate of 54% during the same period.
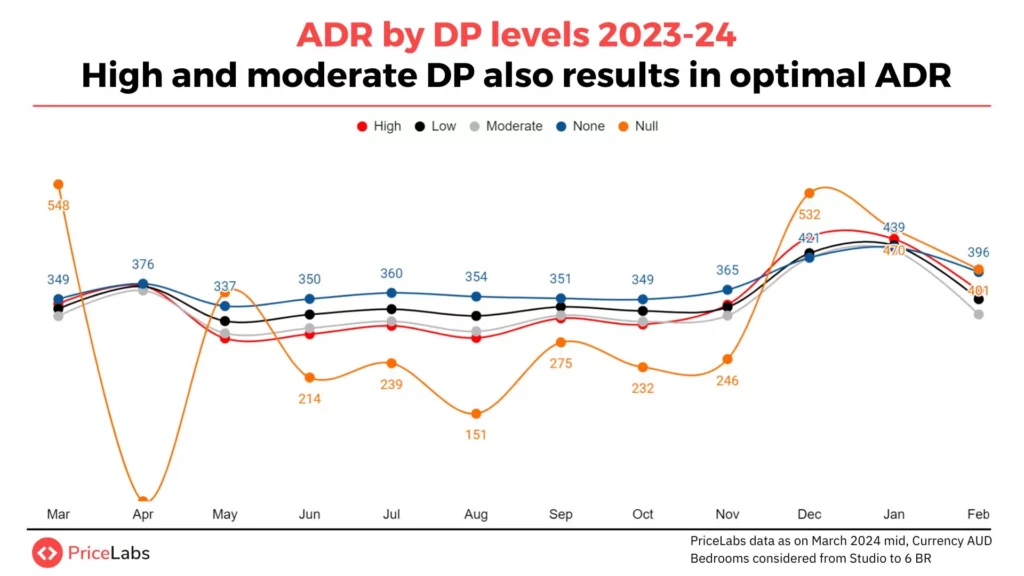
ADR
If your listing utilizes either high or moderate levels of dynamic pricing, there is a high chance that you’re pricing appropriately. This chart also shows an interesting trend. Listings that do not use dynamic pricing at all were priced the lowest throughout the year. However, in April, they were priced the absolute lowest and have been the most volatile throughout the year.
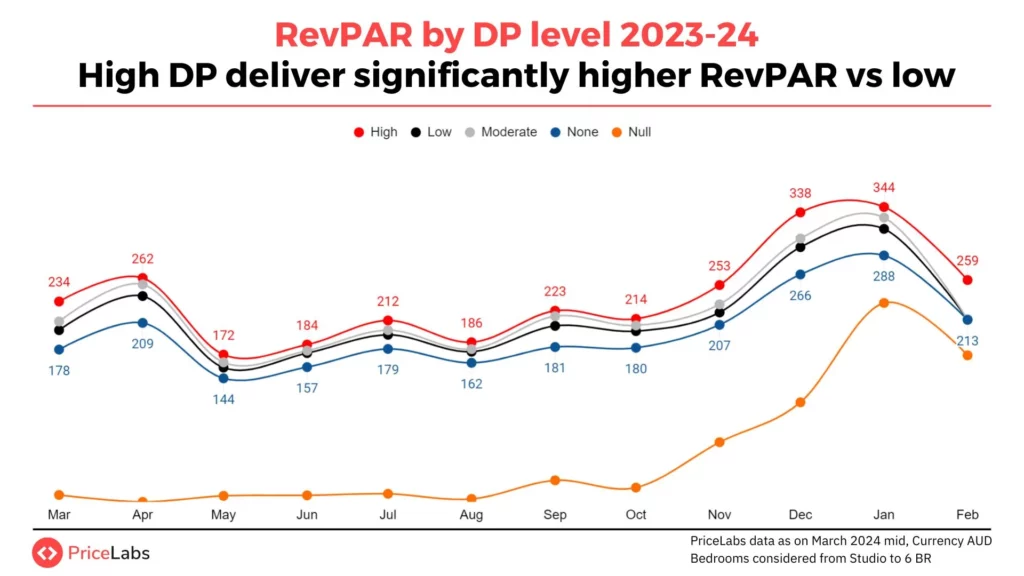
RevPAR
RevPAR has also seen trends similar to those of ADR. When your listing utilizes high dynamic pricing, your RevPAR is likely to be high compared to those that either do not use dynamic pricing or do not use dynamic pricing at all.
Key Insights of the Australian Short-Term Rental Market 2024
- Short-term rental listings in Australia have grown by 11% in the last year.
- New South Wales and Victoria cover about 60% of the short-term rental listings in the Australian market.
- Key revenue parameters such as occupancy, ADR, and RevPAR are stable from 2022 to 2023 and from 2023 to 2024.
- New South Wales and Western Australia deliver the highest RevPAR, but they take different approaches. New South Wales maximises ADR, while West Australia maximizes occupancy.
- Only 25% of the listings in the market have high to moderate levels of Dynamic Pricing.
- Listings with Dynamic Pricing show significantly higher occupancy, ADR, and RevPAR.
Choose PriceLabs to Stay Competitive in an Extremely Competitive Market
PriceLabs is a revenue management solution for the short-term rental and hospitality industry, founded in 2014 and headquartered in Chicago, IL. Our platform helps individual hosts and hospitality professionals optimize their pricing and revenue management, adapting to changing market trends and occupancy levels.
Choose PriceLabs to increase revenue and streamline pricing and revenue management. Sign up for a free trial at pricelabs.co today.
- Dynamic Pricing Adjustments: PriceLabs continuously monitors market conditions and adjusts your listing prices in real-time to maximize revenue and occupancy. This dynamic pricing strategy helps ensure that your rates remain competitive, which is essential for maintaining high booking volumes and meeting Airbnb’s hosting criteria.
- Customized Minimum Stay Requirements: PriceLabs allows you to set customized minimum stay requirements based on your preferences and market demand. By strategically adjusting minimum stay lengths, you can optimize your booking calendar, minimize gaps between reservations, and maximize your earning potential, all of which contribute to Superhost eligibility.
- Performance Analytics and Insights: PriceLabs provides detailed analytics and insights into your listing’s performance, including occupancy rates, revenue generated, and pricing trends. By monitoring these metrics, you can identify areas for improvement, adjust your pricing strategy accordingly, and maintain a competitive edge in the market, all of which are vital for Superhost recognition.
- Integration with Airbnb: PriceLabs seamlessly integrates with Airbnb, allowing you to manage your pricing strategy directly from the Airbnb platform. This integration streamlines the hosting process, saves time, and ensures consistency in pricing and availability across all your listings, which contributes to a positive guest experience and, ultimately, Superhost status.
- Map listings across booking channels: PriceLabs makes it easy for you to make pricing adjustments and minimum night settings across booking channels.
- We integrate with 100+ property management systems and booking channels.