The post Meet Revenue Estimator Pro: Swift and In-depth Revenue Estimates for Any Property Address Worldwide appeared first on PriceLabs .
]]>What is Revenue Estimator Pro?
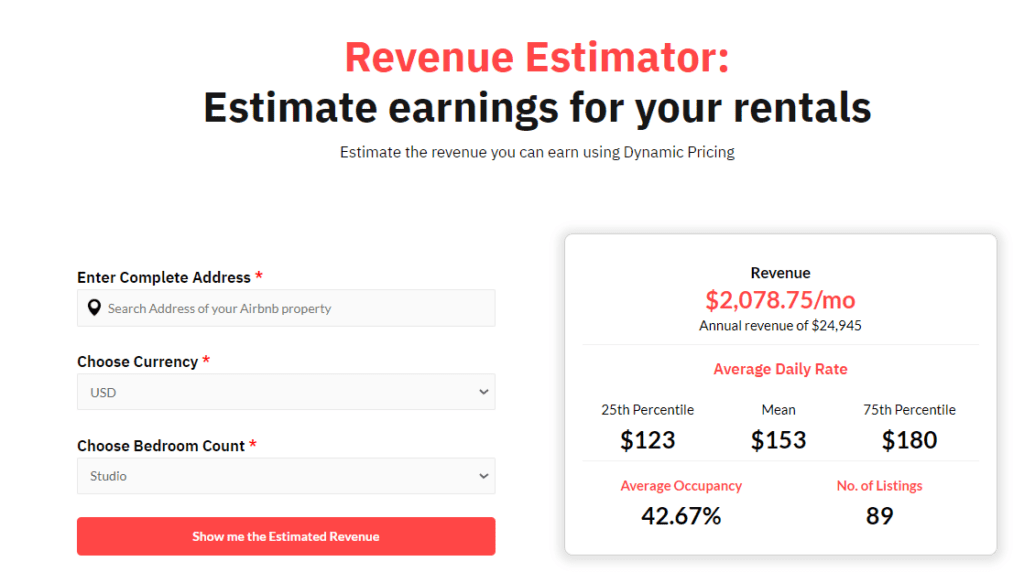
Revenue Estimator Pro offers instant revenue estimates for properties, for any address worldwide. Whether you’re looking at properties in your local area or a new market, this tool provides detailed revenue reports instantly, including monthly revenues, average daily rates, and occupancy rates. It’s a straightforward solution for anyone looking to make quick, informed decisions.
For Property Investors
If you’re considering new investments, Revenue Estimator Pro can help you quickly assess a property’s potential. Enter an address and get an instant snapshot of expected earnings. You see how the location stacks up against the competition and market trends. This immediate insight can guide you to make better investment choices, focusing on properties that offer the best return.
For Property Managers
Property managers juggling multiple listings will appreciate the efficiency Revenue Estimator Pro brings. Beyond generating estimates, the tool offers a centralized dashboard where all estimates are conveniently stored. Moreover, the tool creates professional-grade CSVs and logo-branded PDFs for sharing with colleagues, homeowners, realtors, or investors.
Key Features and Benefits
Instant Comprehensive Analysis for Short-Term Rentals
Gain immediate insights into the short-term rental market with our instant comprehensive analysis. Directly access data from Airbnb listings in a flash, bypassing the need for time-consuming manual research on booking websites.
- Global Address Analysis: Quick, detailed insights for any location in the world.
- Revenue Estimates: Comprehensive monthly and annual earnings projections.
- ADR Insights: Monthly and yearly average daily rate estimates
- Occupancy Projections: Expected demand, monthly and annually.
- Seasonal Trends: Insights into how seasons affect your revenue.
- Local Market Comparison: Compare your property with nearby listings.
Tailor Your Analysis with Customizable Comparables
Make your investment analysis work for you. With our customizable comparables feature, you start with a basic estimate and then fine-tune it to your specific requirements.
- Initial Quick Estimate: Get a starting estimate instantly with just an address.
- Detailed Comp Set Modification: Refine your analysis by modifying comparison sets based on various criteria.
- Map-Based Area Selection: Refine your comp set by selecting a specific zone on a map.
- Property Feature Selection: Choose properties based on characteristics like bedroom count or amenities.
- Property Performance Filtering: Pick properties according to their review score
- Dynamic Recalculation: The tool updates your estimates in real-time
Organize and share: Manage all estimates in one spot
Find all your estimates in one place and download them as professional, logo-customized PDFs or as CSV files. Perfect for property managers who need to create and share a
- All Estimates in One Place: Easily find and access all your past estimates.
- PDF Download: Convert estimates into downloadable PDFs for offline use.
- Custom Branding: Personalize each PDF with your logo for a professional touch.
- Effortless Sharing: Quickly and securely share estimates with clients or team members.
How to Access Revenue Estimator Pro
Accessing Revenue Estimator Pro is straightforward. If you are not a current PriceLabs, start by creating a PriceLabs account here.
If you are a current PriceLabs user, find the Revenue Estimator Pro under the “Market Research” tab in PriceLabs, listed as the second option. Bonus: If you have at least one listing added to our Dynamic Pricing tool, you’re entitled to two free estimates to explore the tool’s capabilities .
You can also find a complete guide on how to get started with Revenue Estimator Pro here.
Revenue Estimator Pro is here to make property revenue estimation more accessible and straightforward for investors and managers alike. By offering instant insights and easy-to-use features, it helps you stay informed and competitive in the property market. It is an accurate, next generation Airbnb calcualor. Give it a try and see how it can improve your property management and investment decisions.
The post Meet Revenue Estimator Pro: Swift and In-depth Revenue Estimates for Any Property Address Worldwide appeared first on PriceLabs .
]]>The post Breakthrough Release Follow-Up, New PMSs, and Referral & Affiliate programs appeared first on PriceLabs .
]]>We address some of the most frequently asked questions that have surfaced since the launch. We understand that with the introduction of 27 new features, some gems might have slipped under your radar. So, we’re going to spotlight a few standout features that deserve your attention.
Exploring exclusive features that only PriceLabs brings you
With the introduction of the Breakthrough Release, we have unveiled a set of unprecedented product features that are unique in the market. Here’s our team’s top picks:
Market-driven Last-Minute and Far-Out Customizations:
In hospitality, nights are a perishable product – if a night goes unbooked, that potential revenue is lost forever. The timing of a booking, known as the booking window, is a key factor in your pricing strategy.
Without dynamic pricing, you might set rates too high for last-minute inquiries, which could prevent potential bookings. However, in markets where demand outstrips supply, lowering prices excessively could lead to missed revenue opportunities.
Similarly, offering significant discounts isn’t always necessary for far-out bookings made well in advance, especially in markets where people are likely to book regardless.
Our new feature, Market-Driven Dynamic Last-Minute and Far-Out Customizations, is here to help. Here’s where PriceLabs stands out: unlike competitors who apply a one-size-fits-all approach to discounts and premiums across all markets, our feature adjusts your pricing based on real-time conditions in your specific local market.
To understand more, check out this article from our data science team.
Exciting New Customizations for Multi-Unit Operators: Introducing Hotel Weights and Hotel CompSets
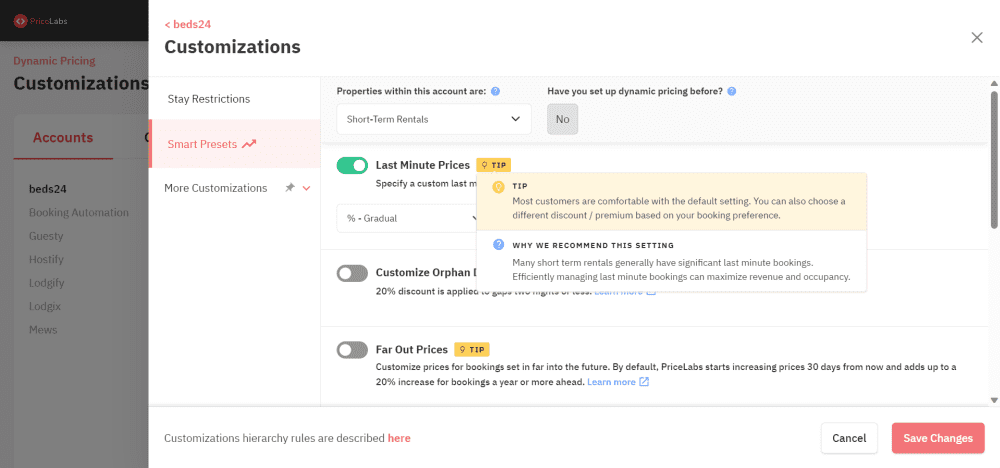
If you’re operating multi-unit accommodations like aparthotels or serviced apartments, we have some thrilling updates tailored just for you. Under our Smart Presets, when you select “Multi-Unit” as your property type, you can access advanced customizations to fine-tune our pricing algorithm.
These innovative customizations – Hotel Weights and Hotel CompSets – are unique features exclusively available on PriceLabs. They set us apart by offering multi-unit operators an unmatched level of control and flexibility in their pricing strategy tailored to the specific dynamics of their local market.
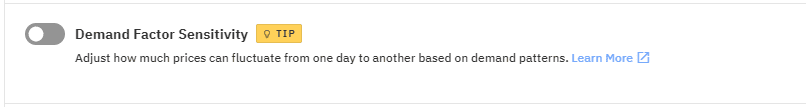
How to get there? Simply toggle on “Demand Factor Sensitivity“, and voila, two new options – “Hotel Weights” and “Hotel CompSets” will be displayed.
- Hotel Weights: Decide the degree to which hotel pricing trends should influence your property’s rates. Balance or adjust the impact of hotel-related pricing data on your listings, benefiting those with hotel-like establishments.
- Hotel CompSets: If local hotel rates hold a greater influence on your property’s prices than nearby short-term rentals, our “Hotel CompSets” customization is your solution. Choose which neighboring hotels should affect your pricing strategy.
Quick Tips and Clarifications on the Breakthrough Release
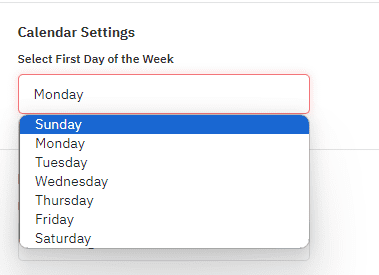
Choose Your Calendar Start Day
We’ve been listening, especially to our European users who have long requested this feature: the flexibility to choose the start day of their week. You asked, and we delivered! Now, you can customize your pricing calendar to begin on a Monday or any other day that suits your preference. Go to Your Account, then Account Settings, and then Advanced Settings, and use the “Select First Day of the Week” field.

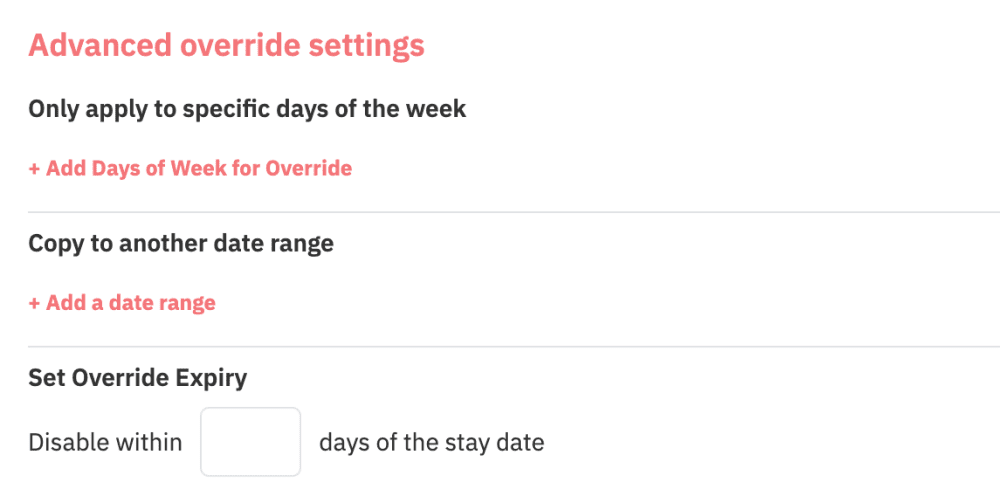
Expiry Date Option for Date-Specific Overrides (DSO)
You may already know that a Date-Specific Override (DSO) allows you to manually adjust the price recommendations made by our algorithm for specific dates. Often, a DSO is used to increase prices for one or several days above PriceLabs’ price recommendations. This could be due to expected high demand, local events, or other factors that might not be fully captured by the algorithm.
However, if the anticipated high-demand bookings do not materialize as expected, your DSO might inadvertently block potential last-minute bookings by maintaining higher prices. This can counteract discounts intended to fill vacant slots close to the date.
To cater to this, we have introduced an advanced setting that allows you to set an expiry timeframe for a part of the DSO. Higher prices won’t obstruct potential last-minute bookings as they’ll automatically expire after a certain period.
Consider scenarios like Milan’s Fashion Week, where last-minute pricing can skyrocket due to a surge in demand. By implementing an override with an expiry date closer to the event, you ensure you don’t underprice in advance while also avoiding being overly expensive last-minute, allowing you to sell based on real-time information from PriceLabs.

Smart Presets:
To give you control over our algorithm, we provide more than 30 customization options. For newcomers, navigating through all these options can be overwhelming.
Smart Presets allow you to define your listing type – be it short-term rental, mid-term rental, or a multi-unit building. Based on this, they offer a recommended set of customizations and advice on value selections. This feature streamlines the process of navigating multiple settings, saving time and helping you get the most out of PriceLabs.
For our seasoned users, this is an invitation to explore overlooked features and receive suggestions for potentially better settings.
Note that any changes made in the Smart Presets will also apply to other areas where these customization options exist, ensuring a consistent and efficient user experience.
Performance Metrics: Where to start? What is the difference between Occupancy and Adjusted Occupancy?
We’re thrilled to introduce enhanced Performance Metrics in our latest Breakthrough Release, offering you over 40 tailored metrics. Given the extensive options, we’ve set ‘Listing Occupancy’ as the primary metric to help you gauge property health. It represents the proportion of booked dates to total dates, and a 100% value indicates all dates, even those reserved for the owner, are booked.
If you’re looking for a more detailed perspective, ‘Adjusted Occupancy’ is available, which excludes owner-occupied dates, providing a transparent view of paid or adjusted stays.
Seeking a creative way to use our metrics? Here’s a tip: Take the ‘last booked date’ (the most recent date when a guest booked your property) and combine it with ‘forward occupancy’ (the upcoming dates when your property is available). By doing this, you can spot those listings that have openings in the near future but haven’t been getting any new bookings lately. It’s a great way to see which properties might need a little extra attention or a promotional push.
Desktop App
The new PriceLabs Desktop App has sparked discussion among users regarding its differences from the browser version and its platform availability. To clarify, this standalone application provides a more dedicated and efficient PriceLabs experience, distinct from the browser version.
The free app can be downloaded directly from PriceLabs, not from any app stores. However, to view the download link, you must access PriceLabs via a Chromium-based browser like Google Chrome. Once downloaded, this app is compatible with all computers, regardless of whether they are Microsoft or Mac-based.
PriceLabs connects with 5 more PMSs
Here are the 5 PMSs joining our list of 100+ integrations:
- Hoone
- LiveRez
- RentalWise
- Vesta
- VRBookings
Earn credits and money by educating your contacts about PriceLabs!
Discover our Referral program.
Recommend PriceLabs to friends and earn credits. Find your unique referral code under Billing > Refer & Earn in your PriceLabs account.
Meet our new Affiliate program.
If you’re a podcaster, blogger, community leader, Airbnb coach, or short-term rental expert, or if you’re in revenue or property management, boost your content by joining our Affiliate program. Offer your audience valuable tools and insights. You’ll earn 10% of the billing revenues generated through your referrals.
The post Breakthrough Release Follow-Up, New PMSs, and Referral & Affiliate programs appeared first on PriceLabs .
]]>The post Trailblazing Revenue Management: PriceLabs’ Breakthrough Release Details appeared first on PriceLabs .
]]>Fueled by cutting-edge data science and user feedback, this Breakthrough Release marks a pivotal moment for us, our suite of products, and our community of users.
Specially designed for medium to large property management companies, these innovations set the tone for the next chapter in revenue management. Whether you’re a property manager or a revenue manager, this transformative release promises substantial benefits for all.
This marks a significant milestone for our company. We’re grateful for the support of our customers and partners. You can find out here how our co-founders, Anurag, Richie, and Sana, consider this important release.
With more than 20 new features and tools, we’re pushing the boundaries of revenue management. Here’s what the Breakthrough Release delivers:
- Enhanced Precision and Relevance in Pricing
- Efficient and Streamlined Operations
- Swift Access to Critical Metrics
- Industry Recognition and Innovation
- Global Solutions for Short-Term, Mid-Term, and Multi-Unit Rentals
Let’s delve into the innovative tools featured in the Breakthrough release.
Breakthrough Release’s star feature: Hyper Local Pulse (HLP) Revolutionizes Dynamic Pricing

Meet Hyper Local Pulse (HLP), our revolutionary dynamic pricing algorithm. As evident from the name – it harnesses a hyper-local data set to optimize your rates to maximize revenues. HLP ensures unparalleled precision and adaptability in pricing strategies.
Within three months of using HLP, new PriceLabs users experience an average 26% boost in RevPar (Revenue per Available Night).
HLP’s Key Features and Benefits:
With HLP, you get:
- Hyper-local Relevance: Leverage hyper-local comp-sets for pricing decisions, enabling unmatched precision and relevance in adjusting for seasonality and specific days of the week.
- Improved Event and Holiday pricing: Our system has been enriched with a four-way event detection. It looks at the pacing from the previous year, picks up early demand signals for upcoming dates, takes cues from future competitor pricing, and incorporates hotel price indications.
- Rapid Market Adaptability: The swift response mechanism guarantees you seize the full potential of responsive seasonal and event pricing.
- Time-saving: Enjoy a significant reduction in the need for manual pricing interventions.
- Transparency: Our data science team has published how the algorithm was conceived and what data is used.
A quick look under the hood of our new pricing algorithm
The switch to HLP has been a two-year exercise in the making. HLP has been enabled by some game-changing technical improvements we have made. Here’s a summary:
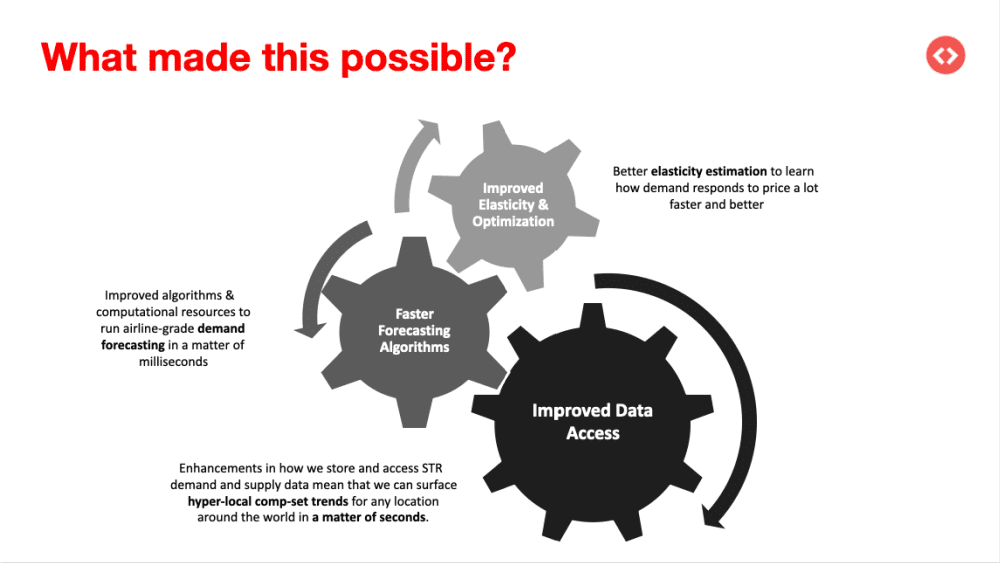
If you want to know more about how HLP works, you can read this in-depth overview from our data science team on how the pricing algorithm works.
What Our Users Are Saying About Hyper Local Pulse (HLP):
“The new algorithm has really taken an already stacked pricing tool to the next level! The way the new algorithm updates daily to changing market conditions is truly amazing. Grand Welcome has entered 50+ new markets in the last 2 years with another 20+ markets going live before the end of 2023. This is going to save us around 75% in setup time for new markets and allow us to put more focus on the areas that matter.”
Jon S | Business Intelligence Manager at Grand Welcome
“The reduction in manual overrides is a game-changer for us. With the new algorithm, we find ourselves relying less on manual interventions, allowing us to efficiently scale our portfolio without sacrificing accuracy or control.”
Adrienn Janics | Revenue Management at Angelhost
“The new algorithm better leverages PriceLabs’ built-in seasonality & demand adjustments to optimally set up your pricing calendar. Not only have we seen an improvement in Day-of-Week pricing, but we’ve also seen an improvement in peak demand date pricing.”
Fabio Castiblanco | Head of Revenue & Analytics at SoSuite
Availability and Migration
We invite you to experience the HLP difference, a testament to PriceLabs’ commitment to innovation and excellence. To find out whether your listings are already running under the new algorithm or how to switch to it, read this article.
Performance Metrics
Successful revenue management relies on swift action. When handling many listings, pinpointing the underperformers can be time-consuming. While our Pricing Dashboard and Multi-Calendar pages offered Occupancy metrics, we recognized the need for a broader set.
Introducing our enhanced Performance Metrics: Filter and sort with more than 40 metrics tailored to your monitoring preferences. By focusing on the metrics most relevant to your business, you can efficiently assess your listings’ performance and adjust where needed.
Smart Presets
While PriceLabs’ algorithm works hyper-locally and optimizes revenue, every individual perceives risks differently. Thus, the need for customizing PriceLabs to your expectations comes in. While we build world-class algorithms, we’ve continued to focus on making PriceLabs’ as customizable as needed. PriceLabs offers over 30 customization options; however, navigating through them can feel daunting, especially for newcomers.
Our Solution? Smart Presets. This tool effortlessly guides you in adjusting PriceLabs to fit your property type, offering hands-on suggestions for optimal settings.
Benefits:
- Specify the type of listing—whether it’s a short-term rental, mid-term rental, or a multi-unit building. We’ll then provide you with a recommended suite of customizations and advice on value selections.
- Save time and get the best out of PriceLabs by focusing on the essential settings.
- With Smart Presets, navigating through many settings is straightforward and user-friendly.
Desktop App
When editing a large portfolio, a lag or delay can disrupt your workflow, resulting in time lost in your busy day.
With the PriceLabs Desktop App, we’re bringing solutions to your computer:
 Easy Access: Download our app onto your computer. Once installed, no more opening the browser to access PriceLabs. It sits on your desktop for quick access.
Increase Efficiency: Using your computer’s capabilities, PriceLabs’ desktop app runs faster and more smoothly than on browsers. This allows for effortless navigation, management, and updating of vast portfolios, ensuring a seamless user experience
You might be wondering, what else are we doing to improve response times? We have been working on making our algorithms and data processing fast. In addition, we are working on making the multi-calendar faster – coming later this year.
Team Management
Empower your team, ensure accountability, and monitor with clarity— PriceLabs has got you covered.
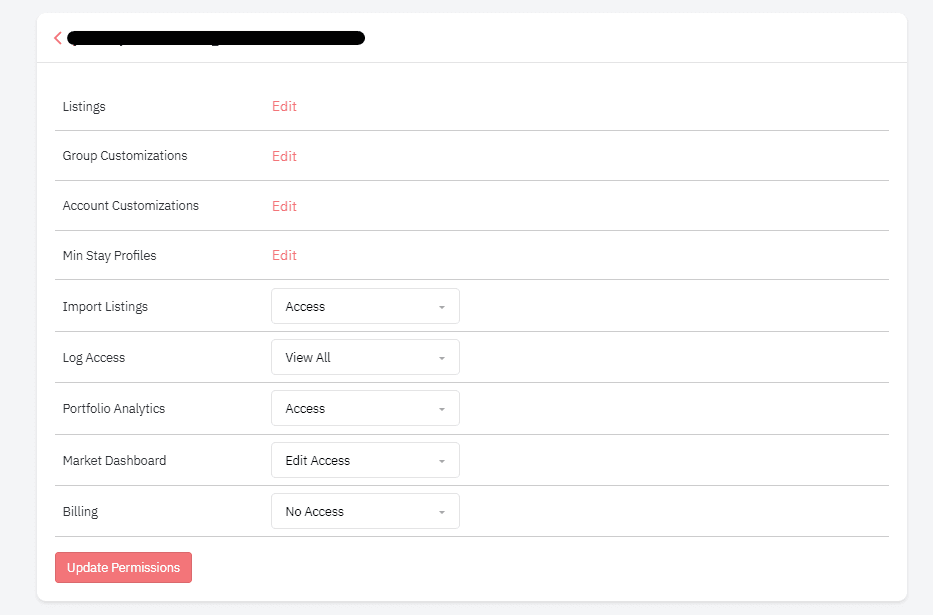
Simplified Delegation: Granting view/edit permissions to a group ensures team members can independently manage all listings within that group, promoting efficiency and ownership.
Transparent Oversight: Our detailed account logs let you quickly identify who made what change and when, which ensures transparency and accountability.
We are working on many more changes to make team management easier. Would love to hear if you see any limitations with current functionalities!
Dive Deeper: More Tools and Features of the Breakthrough Release
Intelligence: Reduce the need for human intervention
Market-driven Last-Minute and Far-Out Customizations:
The data access and elasticity models we created for HLP allow us to better calculate market-last-minute and far-out customizations.
In an industry first, these new versions of the customizations dynamically adjust the default values for last-minute discounts and far-out premiums based on daily updated hyper-local market data. Unlike competitors who rely on fixed values for these discounts and premiums, PriceLabs dynamically adjusts to each listing’s market conditions. Read this article for some observations from our data science team while working on market-based last-minute and far-out customizations.
Benefits:
- Optimal Pricing Strategy: Only customizations in the market that leverage extensive market data to provide accurate and competitive pricing recommendations. This ensures properties remain relevant in changing market conditions.
- User Flexibility: While the system offers automated insights for maximizing revenue, users retain the control to tailor pricing according to their specific needs and preferences.
Note: Only users of the HLP algorithm can access these customizations.
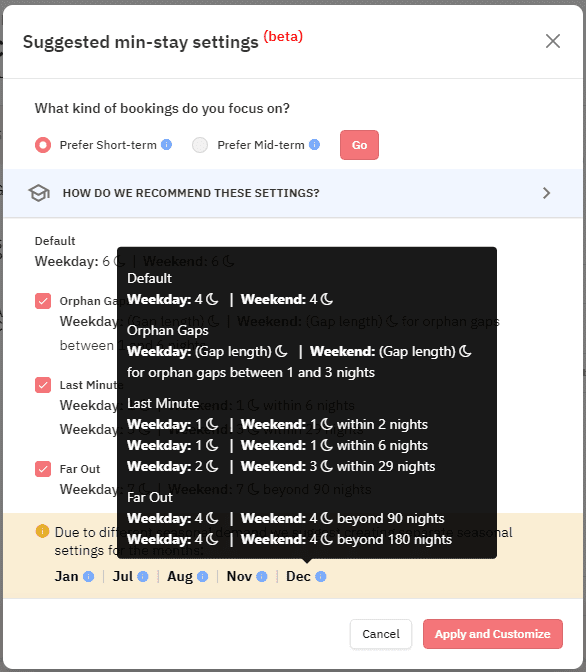
Enhanced Min Stay Recommendation Engine and Min Stay Flexibility
Our experiments found that optimal use of Minimum Stay restrictions can help you increase your revenues by 5-10%. Yet, calculating minimum stay restrictions for each market and listing is time-consuming and math-heavy.
Our data science team has developed the industry-first and only Min Stay Recommendation Engine, which provides annual minimum stay recommendations and specific seasonal suggestions for months that diverge from typical patterns. For this release, we’ve improved the recommendation engine by factoring in the individual performance of the listing alongside market trends.
Now, tweaking your minimum stay restrictions to optimize revenue is a matter of a few clicks.
Min Stay Flexibility
- Min Stay Profiles: If you manage a few properties or your minimum stay restriction changes by season – setting Min Stay customization in PriceLabs was time-consuming. Enter Min Stay Profiles. Set once and use multiple times!
- Custom Seasonal Profile + Profiles: Min Stay Profiles can now be integrated with Custom Seasonal Profiles, ensuring hosts and property managers account for seasonal demand. For example, longer minimum stays during peak seasons can enhance occupancy.
- Advanced Min Stay Customization: Besides the standard set of minimum stay customizations, PriceLabs offers additional customizations like Adjacent minimum stay customization – used to prevent or reduce gaps and some on-demand customizations.
Seasonality customization
With HLP, we can offer additional flexibility to users via our Seasonality Customization (formerly called Custom Seasonal Factor). You can now easily select between 4 out of the box pricing strategies based on your preference:
- Conservative: This setting moderates the calculated seasonality, slightly reducing prices in the off-peak season and raising them mildly during peak season.
- Recommended: The default setting utilizes the standard seasonality determined by our HLP.
- Aggressive: Intensifies the PriceLabs’ seasonality by significantly raising prices during high-demand periods and lowering them more during low-demand times.
- No Seasonality: Ideal for properties catering to consistent demand, like those serving business travelers year-round. This option deactivates seasonal pricing adjustments, maintaining a steady rate year-round.

Hotel Weights and Hotel CompSets customizations
Tailored Algorithm Customizations for Multi-unit Operators:
What’s New? For operators of multi-unit accommodations like aparthotels and serviced apartments, we’re rolling out advanced customizations within our Smart Presets to provide refined control over our pricing algorithm.
- Hotel Weights: Recognizing that certain accommodations, such as aparthotels, can be influenced by short-term rental and hotel market trends, we are introducing the “Hotel Weights” feature. This allows operators to determine the extent to which hotel pricing trends impact their property’s rates. In essence, it offers the ability to balance or adjust the influence of hotel-related pricing data on your listings. It primarily benefits hotels or hotel-like establishments.
- Hotel CompSets: Should you believe that local hotel rates have a greater bearing on your property’s prices than neighboring short-term rentals, our “Hotel CompSets” customization is designed for you. This tool lets you select which neighboring hotels should influence your pricing strategy. By default, PriceLabs considers the 10 nearest hotels when determining pricing.
Base Price and Minimum Price Nudges:
We’ve introduced ‘nudges,’ our smart data-backed notifications, to fine-tune your pricing strategy. These nudges include:
- Base Price Nudge: It gives you a heads-up when an adjustment to your base price might be needed. The Base Price Nudge ensures that your listing’s foundation price remains in sync with current market trends, enhancing the likelihood of consistent bookings.
- Minimum Price Nudge: It helps ensure your listings remain attractive, especially during off-peak seasons or slower markets. Sometimes, even if you lower your Base Price, you might still not get bookings if it’s too close to your Minimum Price. Our new nudges ensure a balance between your base and minimum price, optimizing your chances of getting booked.
Benefits:
- Streamlined Revenue Management: Takes the guesswork out of pricing, guiding you towards the best decisions.
- Stay Ahead with Automated Alerts: Reduces the need for constant monitoring, ensuring your properties are competitively priced.
Analysis: Quickly evaluate performance
Pacing Charts and Booking charts in Portfolio Analytics
The Portfolio-Level Pacing Charts and Booking Reports are analytic tools that give users a comprehensive view of their listing’s performance. Users can gauge their market position and make informed decisions by comparing current rates and occupancy metrics against historical data and market averages. In response to your feedback for this release, we’ve kept the booking chart as it is but defaulted the graphs to display a monthly view instead of a daily view.
Benefits:
- Strategic Positioning: Users can understand and adjust their pricing and listing strategies based on market trends and past performance.
- Enhanced Efficiency: Quick access to detailed insights and reports enables timely reactions to changing market conditions, maximizing profitability.
Market Dashboard’s Portable Comp-Sets
Market Dashboard provides a comprehensive snapshot of the competitive environment for your listings. It’s an essential tool, allowing you to curate sets of competitors for easy reference and integration with other PriceLabs products. For this release, we’ve introduced powerful filters that help you zero in on the exact local market you want to analyze.
- Choose a specific market that suits your listings, moving beyond the confines of just a neighborhood or city.
- Apply detailed filters to curate a competitor set tailored to your business needs (e.g., create a market view with only beachfront 3-bedroom listings with a pool and guest ratings above 4.7).
- Save your curated set for quick access within Market Dashboard, or utilize it in Neighborhood Data and Portfolio Analytics for performance comparison. These comparisons include static data like occupancy and constantly updated projections such as future occupancy and “same time, last year” data for instant comparisons.
Compare Competitor Calendar
Located in the Neighborhood Data tab, the “Compare Competitor Calendar” tool allows you to compare your listing prices with up to 10 local competitors, offering insights for a 365-day timeframe.
Benefits:
- Informed Pricing Strategy: Adjust your rates competitively by directly comparing with neighboring listings.
- Spot Trends: Detect pricing patterns and booked nights among competitors.
- Detailed Insights: Direct access to competitors’ Airbnb listing pages provides a comprehensive view of their offerings, from photos to amenities
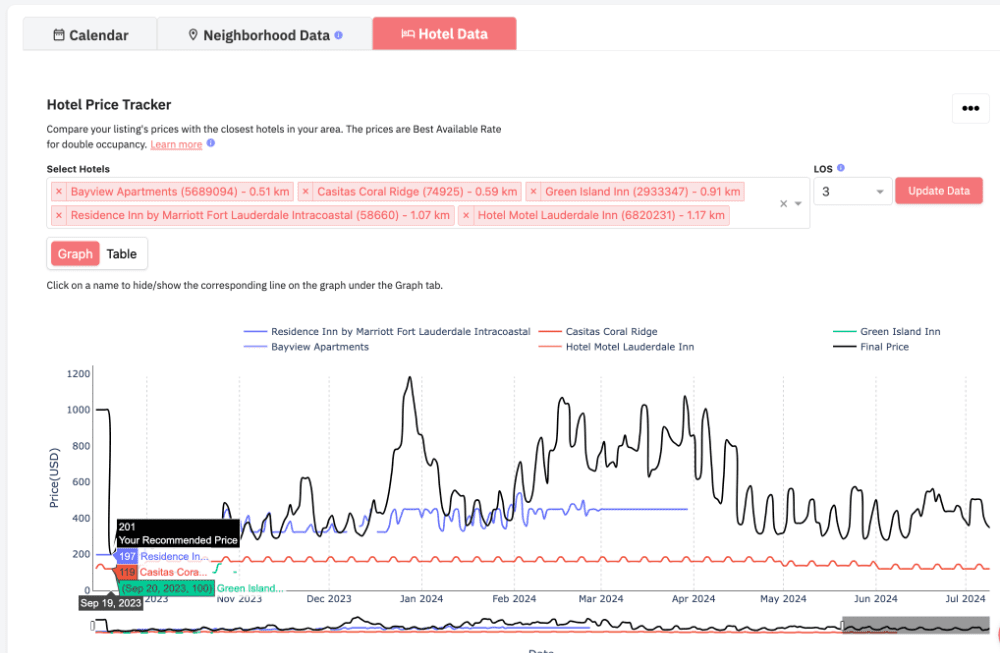
Hotel Data with Length-of-stay (LOS)
The recently introduced Hotel Data tab provides a comprehensive insight into the local hotel market. This is especially useful for businesses offering short-term accommodations, like apartments or aparthotels, which often find themselves competing with neighboring hotels.
Benefits:
- Competitive Pricing Analysis: Select and monitor up to 350 nearby hotels to get a grasp on their pricing. This insight allows you to tailor your own rates to ensure you remain a viable option for potential customers.
- Length of Stay (LOS) Insights: This tool lets you see how hotels around you alter their prices based on how long a guest stays. So, if many local hotels give discounts for stays of 3 nights or more, you could do something similar to attract longer bookings. Conversely, if hotels up their rates for shorter stays, you might offer a better rate for short stays to get those quick bookings.
Events and Holidays Calendar Feature (Beta):
We’ve just launched the Events and Holidays Calendar feature. For now, it’s only available to a select group of beta users. You will find this feature in two spots:
- Pricing Page: While viewing a specific listing’s pricing calendar, you’ll see an Event/Holidays section right next to it.
- Multi-Calendar Page: When you’re on this page, just click on the context menu for a specific listing to access it.
Benefits:
- Increased Transparency: Get a clear view of upcoming events, holidays, and potential high-demand dates. This clarity can shed light on why certain price recommendations are set for specific dates.
- Informed Adjustments: Spotting these special dates allows you to tweak your prices or minimum stay settings. This is particularly handy if you notice that the recommended prices may not fully reflect the demand due to a nearby event or holiday.
Plus, if you’re aware of an event that isn’t listed, you can report it using this feature. By doing so, you’re not only staying ahead of the curve but also helping to enhance our tool for everyone.
Workflow: Work faster
Access data via API and CSVs
We understand that businesses, particularly property managers and revenue management teams, often require our data integrated directly into their internal systems. To cater to this, our platform allows users to download various tables and graphs in CSV format easily. Furthermore, for those seeking seamless integration, we offer a direct API to connect PriceLabs to your systems.
As we continue to develop and expand our platform, we remain committed to updating these data transfer avenues, ensuring you can always access the most recent and comprehensive data.
- Download data in CSV formats: You can download data from various tools, charts, and graphs. We’ve enhanced the CSV file you downloaded from the Pricing Dashboard for this release. It now includes two crucial pieces of information: the last synced date and any notes associated with each listing. Booked information from the Neighborhood Data graphs
- Customer API: You can also connect with us directly using our Customer API to download data into your systems.
Also, note that we are continuously working on and remain committed to making various data endpoints available via API or CSV.
Sub-Groups
Managing hundreds of listings can pose challenges. One of the significant challenges is ensuring consistent and optimized pricing across various listings without having to customize each one individually. Grouping listings together and applying shared settings can save time and effort, and PriceLabs understands this need.
PriceLabs eases this with:
- Account-Level Customizations: Uniformly adjust settings across all listings connected to a specific PMS, Channel Manager, or Booking Channel.
- Group-Level Customizations: Group listings based on criteria like city names or listing types for collective adjustments.
- Sub-Group Customizations: Delving deeper into customization, we introduce Sub-Groups. While main groups allow you to categorize listings broadly, subgroups refine this even further. Imagine having different neighborhoods with their own 2-bedroom properties. Subgroups let you tweak settings for these 2-bedrooms within their respective neighborhood groups, providing a detailed layer of pricing control.
Choose Your Calendar Start Day
Some people like their calendars to start on a Monday, while others prefer Sunday. We’ve heard you! Now, you can pick the day you want your pricing calendar to start.
Benefits:
- Efficient Planning: Set your calendar the way you’re used to seeing it, making planning a breeze.
- Same Look Everywhere: Whether checking one date or looking at the whole year, your start-day choice stays consistent across our platform.
Expiry Date Option for Date-Specific Overrides (DSO) and Group/Account level DSO:
Imagine you implement a Date-Specific Override (DSO) to secure a higher rate for specific dates. What if those high hopes don’t materialize into bookings? Then, the DSO may obstruct last-minute bookings by counteracting discounts meant to fill vacancies.
To solve this issue, we’ve introduced an advanced setting that allows you to set an expiry timeframe for a part of the DSO. This feature ensures that your DSOs don’t get in the way of potential last-minute bookings.
For instance, if you’ve set overrides for Nov 25 to Dec 5 and you’ve set your DSO to “Erase all overrides if they are last minute defined by 7 days”, here’s what happens when you approach Nov 20:
- Overrides for Nov 25 and Nov 26 will be erased to attract last-minute bookings.
- Overrides from Nov 27 to Dec 5 remain active.
When managing many listings, making individual adjustments for each one, especially for holidays or events, can become a cumbersome task. For a more streamlined approach:
- Use Account/PMS-level date-specific overrides when you want uniform changes across all your listings.
- If different property clusters need separate adjustments, opt for Group-level date-specific overrides. This is particularly useful when specific sets of properties have unique requirements.
Smart Check-In and Check-Out
In some markets, booking properties can be less flexible than other places. Property managers typically fix certain days for guest check-ins and check-outs, sometimes resulting in ‘orphan gaps’ – those vacant one or two-day spaces between longer reservations. Such fixed schedules can often lead to lost revenue opportunities and an inefficient use of property availability.
Our new feature offers two smart functionalities:
Block Check-in/Check-outs that Leave Orphan Gaps:
This feature intelligently prevents bookings that would result in undesirable one or two-day vacancies. For instance, if there’s a potential for a 1-night gap between bookings, the system will block reservations that would cause this, ensuring more prolonged and continuous occupancy.
Allow Check-in/Check-outs on Adjacent Nights:
Property managers often have specific preferred check-in and check-out days, which can inadvertently lead to gaps in the calendar. This feature allows the system to override those fixed days when necessary. For instance, if a property manager prefers check-ins on Fridays and a booking ends on a Thursday, the system can adjust to allow a check-in on that Thursday, thus optimizing occupancy.
Please note that smart check-in and check-out feature is available on request. Contact support@pricelabs.co to activate it.
100 PMS and channel managers Integrations
PriceLabs has set an industry record by integrating with over 100 PMSs and channel managers. This milestone underscores the trust and value tech providers across the industry place in connecting with PriceLabs to benefit their users. In our latest update, we’re thrilled to introduce integration with two more PMSs:
Data Access: Leverage the most powerful data set
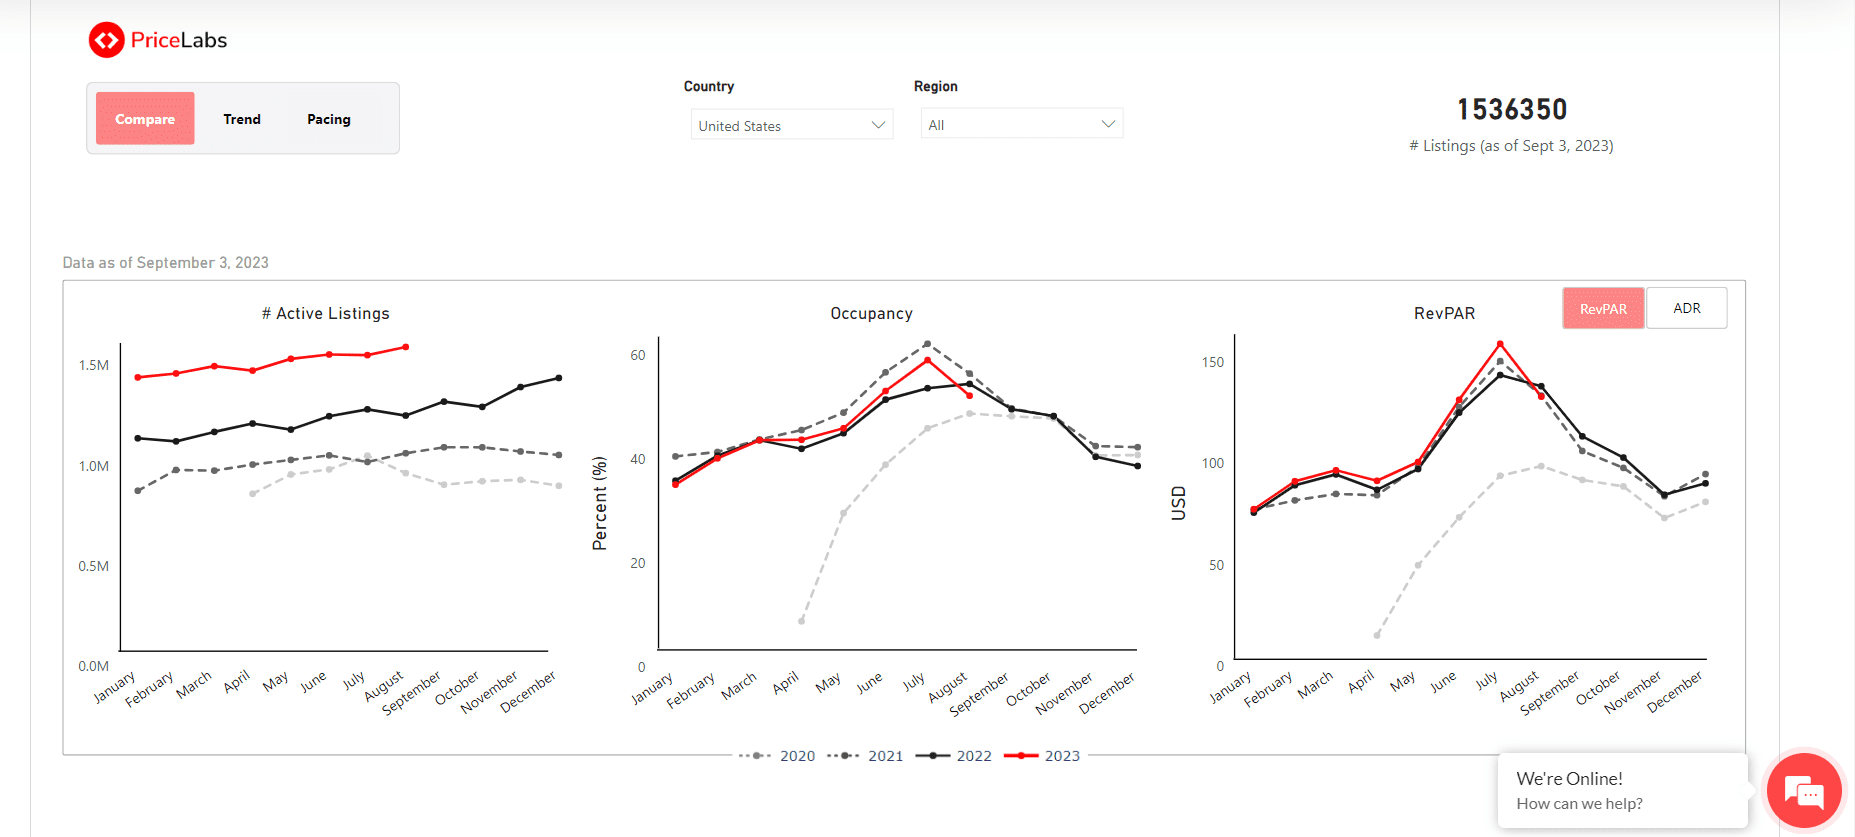
STR Index
Dive into free market reports with PriceLabs’ STR Index, your gateway to global short-term rental data. Whether you’re interested in a specific country or region or want a worldwide overview, the STR Index has you covered. Track and explore metrics from 2020 and get insights into the upcoming year, with monthly data refreshes ensuring you’re always equipped with the most recent insights.
Benefits:
- Broad Coverage: Gain comprehensive insights into any short-term rental market globally, understanding shifts and trends.
- Tailored Insights: Zoom into specific geographies using the Country and Region filters, ensuring the data is most relevant to your interests and operations.
- Versatile Dashboards: With three distinct sections—Compare, Trend, and Pacing—you have multiple ways to interpret and analyze data.
- Compare: Observe year-over-year changes in key metrics such as Active Listings, Occupancy, RevPAR, and ADR.
- Trend: Visualize the trajectory of these metrics over recent years, ensuring you grasp the larger narrative.
- Pacing: Peek into the future, contrasting upcoming year projections with past data for metrics like Occupancy, ADR, and RevPAR.
Revenue Estimator
The Revenue Estimator lets you assess a property’s revenue potential simply by inputting its address. It is a free and simple tool to use. For a more detailed report on potential revenue and local market conditions, create a Market Dashboard.
Benefits:
- For investors and property managers, this is a data goldmine when evaluating a new property’s viability for their portfolio.
- Make informed decisions based on essential metrics estimating a property’s revenue potential.
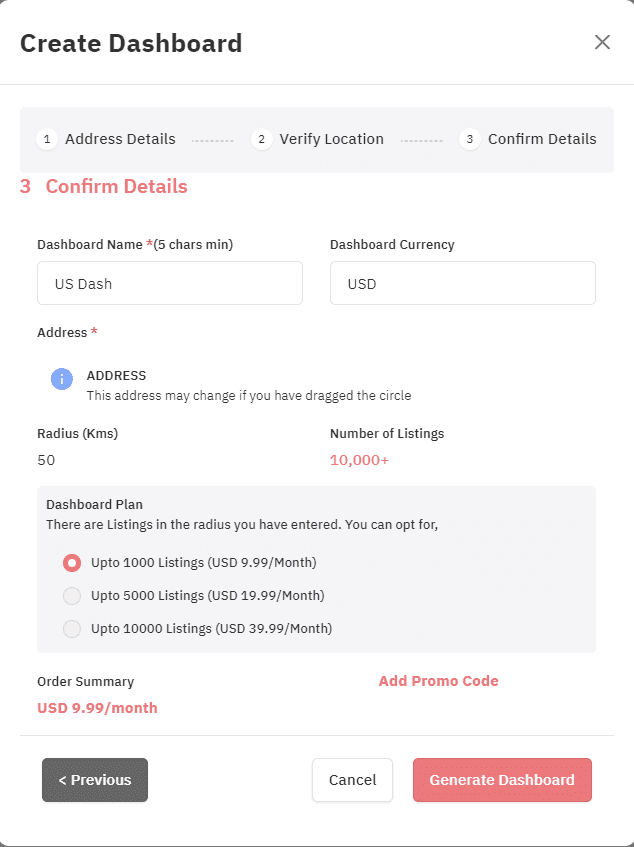
10,000-listing Market Dashboard
For just $39.99 per month, our enhanced Market Dashboard plan provides you:
- Broader Data Access: Dive into insights from up to 10,000 listings, refining your decision-making.
- Superior Market Analysis: Assess potential markets and investment properties with a wider lens.
- Optimized Pricing: Leverage extensive data to pinpoint competitive pricing trends.
- Precision in Comparisons: Evaluate your performance against a vast array of properties, ensuring clarity on your market stance.
- In-depth Trend Insights: Recognize intricate trends to fine-tune your pricing and occupancy strategies.
We are constantly striving to make your journey in revenue management easier! We hope you will find these updates valuable. Please reach out to us if you have any questions.
The post Trailblazing Revenue Management: PriceLabs’ Breakthrough Release Details appeared first on PriceLabs .
]]>The post This month: PriceLabs Calendar Adds Key Booking Data + Far-Out Customizations + PriceLabs speaks Italian! appeared first on PriceLabs .
]]>- We’ve enriched your experience with the pricing calendar, the calendar tooltip, and Neighborhood Data with essential booking data. This means a streamlined workflow and empowered decision-making for you.
- You can now customize your far-out premiums. Choose between gradual and fixed percentages.
- Ciao to our Italian users! PriceLabs is now available in Italian, making our platform more inclusive and user-friendly for our Italian-speaking community.
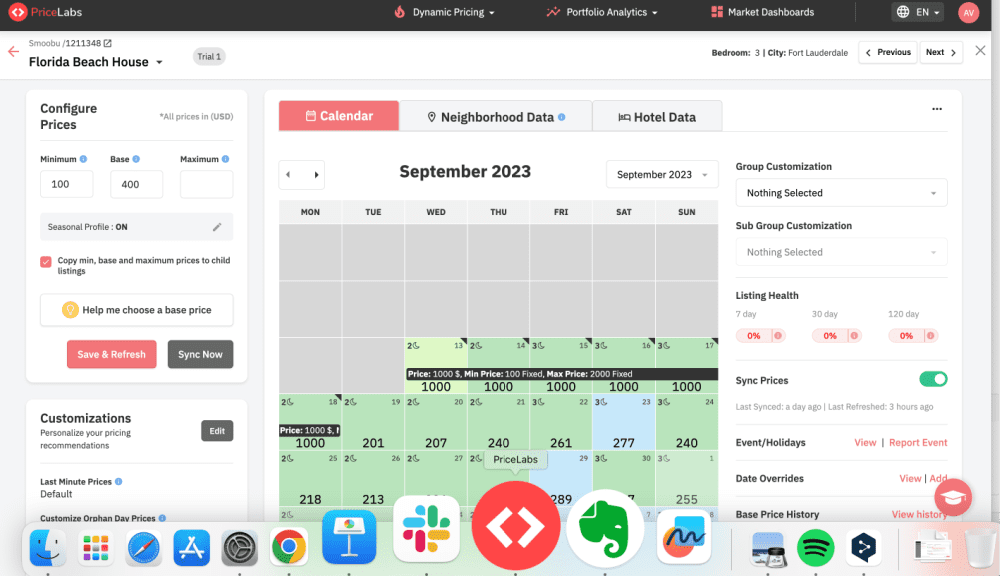
PriceLabs Calendar Update: Adding Booking Data for Improved Decisions
At PriceLabs, we understand that the pricing calendar feature – which allows you to view the availability and pricing of each of your listings on a day-by-day basis – is one of the most widely utilized by our users. We’ve integrated new key information into this calendar to simplify your tasks, save you time, and assist you in making informed pricing decisions.
For example, we now display your booking data, such as check-in dates, directly on your PriceLabs listing calendar.
Below, we detail what changes have been made and the reasons behind these changes and offer a thorough walk-through of the new features.
Why we made these changes
We made these updates in response to your feedback and our observations on how you use PriceLabs in combination with other tools, such as your Property Management System (PMS) and Airbnb account.
The recent enhancements to the PriceLabs calendar come with many benefits designed to streamline your operations and help you make more strategic pricing decisions. Here are the key advantages:
- Time-Saving Convenience: You no longer need to switch back and forth between PriceLabs, your Property Management System (PMS), and Airbnb to manage your bookings and calendar. All the vital booking data, such as check-in dates, are now available right on your PriceLabs listing calendar, saving you valuable time and reducing complexity.
- Clarity and Simplified Decision Making: With the ‘Unavailable’ and ‘Unbookable’ mentions, it’s easier for you to understand why certain dates might be blocked, and where to make adjustments if needed. Also, color-coded demand levels give you a straightforward visual guide to the expected demand for your listings.
Exploring the Upgraded Calendar: A Detailed Walkthrough
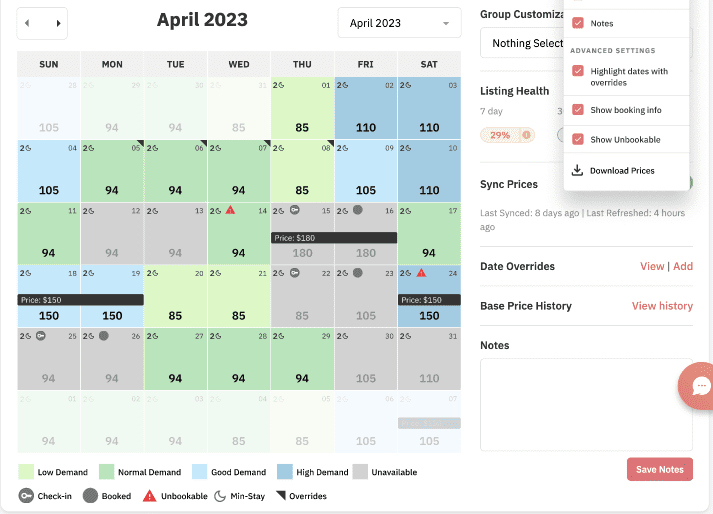
Decoding Numbers & Icons: Intuitive Indicators for Effective Management
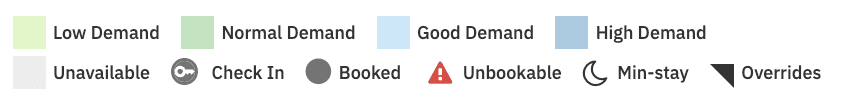
The recent update has enhanced the Calendar view by introducing new indicators:
- Booked: The date is booked.
- Check-in: The date is booked and it’s the check-in day.
- Unbookable: The date can’t be booked due to conflicting minimum-stay or check-in/check-out restrictions in PriceLabs. To avoid such an occurrence, the user must either alter the minimum stay or specify an orphan gap.
These new indicators supplement the existing ones:
- Min-stay: A number adjacent to a moon symbol displays the minimum nights required for a given date.
- Overrides: A grey icon in the top right corner represents date-specific overrides applied at the group or account level.
- Multi-unit Occupancy: The occupancy percentage for multi-unit properties is illustrated as a filled, partially filled, or unfilled pie chart.
These new indicators linked to your own bookings have also been added to the Multi-Calendar page
If you’re managing multiple listings, you’ll find the same new indicators across all listings on the Multi-Calendar page.
More indicators in the tooltip as well
We’ve enhanced the calendar tooltip with additional indicators to give you a clearer picture:
- If a day has a booking, we’ll display the ‘Booked‘ indicator, along with the Average Daily Rate (ADR) at which it was booked and the date when the booking was made.
- We’ll also indicate whether a day is ‘Unavailable’ or ‘Unbookable’ using respective indicators.
Just a quick reminder: the tooltip appears when you hover over any price on your calendar (whether single listing or multi-calendar). It helps you understand how each rate is calculated and what customizations apply to that particular date
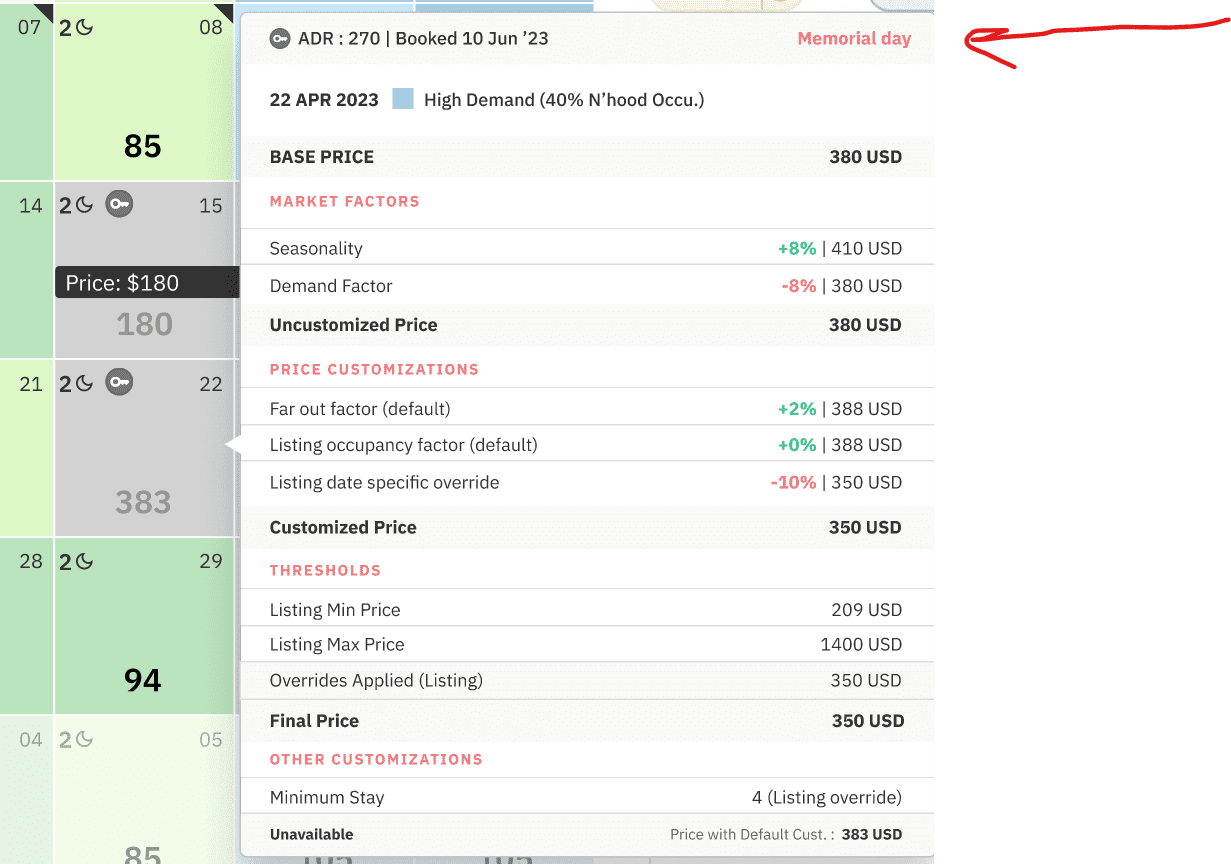
Understanding “Unavailable” vs “Unbookable”
It’s crucial to distinguish between “Unavailable” and “Unbookable” dates. Understanding these differences allows users to take the right action depending on the status of the date.
- “Unavailable” dates are not open for new bookings either because they are already booked (marked with ‘Booked’ or ‘Check-in’ tags) or blocked in your Property Management System (PMS), Airbnb, or Vrbo accounts. Making these dates bookable would require adjustments on the respective platforms.
- “Unbookable” dates denote those that cannot be booked due to minimum-stay or check-in/check-out restrictions in PriceLabs. To rectify this, you would need to revise these settings in PriceLabs itself.
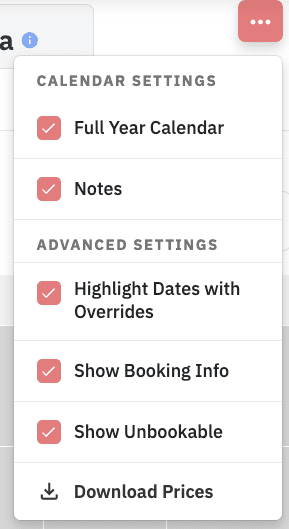
Customizing Your Calendar View with the 3-dot Menu
Using the 3-dot menu, you can customize the type of data displayed on your calendar. You can effortlessly select or deselect elements from your pricing calendar.
- “Show Booking Info” – this feature displays icons for check-ins & booked dates on the calendar. By default, this is enabled.
- “Show Unbookable” – this displays unbookable dates on the calendar, also enabled by default.
Improved Insights: Booking Data in Neighborhood Data
We’ve also updated Neighborhood Data by adding your listing’s booking data for enhanced insights and improved decision-making. Neighborhood Data is a tool that enables you to compare your listing’s performance against its immediate competitors in the local market.
One of the key components within this tool is the “Future Prices” chart. This chart visually shows how your recommended prices compare with the average prices in the market.
We have included booking information in the Future Prices chart for two purposes:
- Unlike the Pricing Calendar view, which only displays one month, the Future Prices chart allows you to view reservations well into the future. This provides a clearer understanding of the availability and pricing of your listing.
- By comparing the Average Daily Rate (ADR) of your listing’s bookings from last year to this year, the Future Prices chart enables you to assess and modify your strategy accordingly.
The Future Prices chart now includes two additional features:
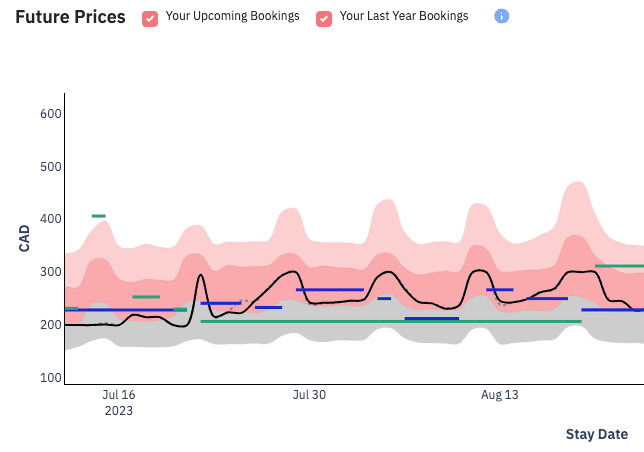
- Your Upcoming Bookings: Represented by a green line on the chart, this feature indicates:
- Your Average Daily Rate (ADR) for each booking for the next 12 months.
- The dates of those bookings.
- For example, a green line from August 8-12 with an ADR of $250 implies those dates were booked together at this average rate. The actual daily rates may vary, but the overall ADR is $250.
- This line extends only to the dates the guest will stay, excluding the checkout date.
- Your Last Year Bookings: This feature provides:
- The ADR and dates for bookings made during the same period in the previous year.
- The blue line represents the duration of the stay, and the height of the line indicates the ADR.
- The exact dates from the previous year are not matched. Instead, it aligns similar weekdays and weekends, allowing for an offset of +/- 1 to 3 days.
Note that these checkboxes may not always be displayed above the chart:
- The new checkboxes for “Your Upcoming Bookings” and “Your Last Year Bookings” are only visible if you have Portfolio Analytics activated.
- You must also have at least one booking, either in the current year or the previous year.
New Far-Out Premium Options
We’re excited to announce another useful update at PriceLabs: the customization of far-out premiums!
Far-out premiums protect against premature bookings at a low price for unannounced events and let you secure higher rates from guests booking far in advance. By default, we apply a gradual 20% premium over seven months from 30 days out, and after 270 days, a flat 20% premium is applied.
Before, you could only toggle far-out premiums on or off. Now, we’ve introduced two new customization options:
- Gradual Percentage (% gradual): Specify when the premium/discount should apply, the maximum value, and the number of days to reach this maximum.
- Fixed Percentage (% fixed): Determine when the premium/discount should apply and set the exact rate.
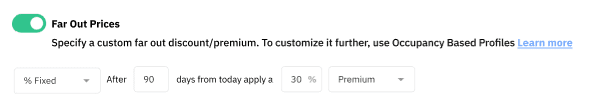
Remember, you can still turn off the far-out premium entirely.
This feature is not visible to all users. To enable it,, please reach out to our support team at support@pricelabs.co.
Parli Italiano? PriceLabs Interface Now Does, Too!

We’re thrilled to announce that we’re now offering our Italian-speaking customers an even better experience. In addition to the training sessions, customer support, and account management already provided in Italian, our product interface is now also available in this language!
How to Switch to Italian Interface:
Switching the default language from English to Italian is a straightforward process. Note that you can change this setting anytime or revert to English whenever you prefer. Here’s a step-by-step guide:
- Login to PriceLabs
- Click on the globe icon located in the top right corner next to your user initials. This can be done from any page within the product
- Select ‘Italian’
- Remember, you can always revert back to English by following the same steps
Remember, you can always revert back to English by following the same steps.
New integration: OTA Sync
OTA Sync is the newest PMS to join the list of 90+ PMSs and channel managers that connect directly with PriceLabs. Welcome to OTA Sync users!
The post This month: PriceLabs Calendar Adds Key Booking Data + Far-Out Customizations + PriceLabs speaks Italian! appeared first on PriceLabs .
]]>The post PriceLabs in French – 2023 French market data appeared first on PriceLabs .
]]>Our Dedication to French-speaking Markets
Why Develop a French Edition of PriceLabs?
The choice to create a French edition is the result of our profound understanding of the significance and unique aspects of French-speaking markets, spanning from France to Quebec, Belgium to Morocco, Switzerland, and numerous African nations. Considering their cultural and linguistic uniqueness, we pledge to deliver solutions customized to these markets’ needs.
PriceLabs Serving French-speaking Market Operators
PriceLabs enables players in the short-term rental market, whether they are individual hosts, vacation rental managers, short-term rental operators, gîtes, chalets, “meublés de tourisme” or aparthotels, to optimize their rates and occupancy rates in line with demand. We are proud to count several thousand users in France and other French-speaking countries, including Hoomy, Ma Conciergerie en Normandie and AutomaticBnb
Commitment to Delivering Excellence “en français”
Since our inception, we have always strived to provide our French-speaking customers with excellent service. This includes free weekly training courses, monthly webinars on product updates, and customer support in French. The PriceLabs website also features a French version (https://staging-hellopricelabsco.kinsta.cloud/fr).
Insights into French Short-term Rental (STR) and Seasonal Rental Market
Trends in the French Short-Term Rental Market
The French short-term rental market is extremely dynamic. According to our data:
- The number of listings on Airbnb in France increased by 22% in one year.
- France reached a record peak of 805,000 Airbnb listings in February 2023.
- France is Airbnb’s second-largest market after the United States.
- The density of listings per km² in France is ten times greater than in the United States.
These figures demonstrate the importance of the French market for short-term rentals and the potential effectiveness of our tool for hosts and property managers in France.
Maximizing Revenues with PriceLabs
To celebrate the launch of the French version of our platform, we dedicated a webinar to recurring questions about the tourist, seasonal and short-term rental market.
Working with Hosts and Property Managers using PriceLabs
In a discussion moderated by Romain with contributions from Marie, we share our experiences of working with French-speaking hosts and service providers. Discover how PriceLabs collaborates with industry professionals in France and other French-speaking countries and the similarities and differences with other markets.
Monitoring and Adapting to Major Events
This section explores how PriceLabs enables you to keep track of and adjust to events. Thibault will introduce you to different perspectives, including major upcoming events such as the Rugby World Cup 2023 and the 2022 Paris Summer Olympic Games. Marie will share real-life adaptation cases for two specific announcements, including one for the Olympic Games in Paris and one for the France-Italy rugby match in Lyon.
Using PriceLabs in French
Our French-language user interface is simple and intuitive. Whether you’re an individual Airbnb host or a property manager in charge of several properties, using Price Labs in French can help you improve your performance.
Switching Language from English to French:
- Click on the red circle showing your user initials (example: TM) in the top right-hand corner of your browser.
- Click on Settings.
- Scroll down to Language Preference.
- The default setting is English.
- Click on “English” to open the drop-down menu.
- Select French.
- The interface automatically switches to French.
- You can switch back to English at any time.
Conclusion
Reflecting on Our Commitment
The launch of the French version of PriceLabs is a true affirmation of our commitment to serving French-speaking markets. We are determined to offer our users an optimal user experience, regardless of their language or location.
Invitation to Engage and Provide Feedback
We invite you to try our French version and share your feedback with us. Your satisfaction is our priority, and we’re always ready to take your suggestions on how to improve our product.
The post PriceLabs in French – 2023 French market data appeared first on PriceLabs .
]]>The post PriceLabs en français – Chiffres France 2023 appeared first on PriceLabs .
]]>L’ engagement de PriceLabs envers les marchés francophones
Pourquoi une version française de PriceLabs ?
La décision de développer une version française ne s’est pas prise au hasard. Elle est le fruit de notre compréhension approfondie de l’importance et de la spécificité des marchés francophones, de la France au Québec, de la Belgique au Maroc, en passant par la Suisse et de nombreux pays d’Afrique. Nous nous sommes engagés à offrir des solutions adaptées aux besoins de ces marchés, en prenant en compte leurs particularités culturelles et linguistiques.
PriceLabs au service des acteurs du marché francophone
PriceLabs permet aux acteurs du marché de la location de courte durée, qu’il s’agisse d’hôtes individuels, de conciergeries, de gîtes ou de chalets de luxe, de meublés touristiques ou d’aparthotels, d’optimiser leurs tarifs et taux d’occupation en fonction de la demande. Nous sommes fiers de d’ores et déjà compter parmi nos clients plusieurs milliers d’utilisateurs en France et dans les pays francophones, parmi lesquels les sociétés Hoomy, Ma Conciergerie en Normandie et AutomaticBnb.
PriceLabs en français : Notre engagement pour un service d’excellence
Depuis notre création, nous avons toujours cherché à offrir à nos clients francophones un service d’excellence. Cela comprend des formations gratuites hebdomadaires, des webinaires mensuels portant sur les mises à jour de nos produits, ainsi qu’un support client en français. Le site internet de PriceLabs propose également une version en français (https://staging-hellopricelabsco.kinsta.cloud/fr).
Données du marché de la location de courte durée (LCD) et saisonnière en France
Évolution du marché français de la location touristique
Le marché français de la location de courte durée est extrêmement dynamique. Selon nos données :
- Le nombre d’annonces sur Airbnb en France a augmenté de 22% en un an.
- La France a atteint un pic record de 805 000 annonces Airbnb en février 2023.
- La France est le deuxième marché d’Airbnb après les États-Unis.
- La densité d’annonces par km² en France est dix fois supérieure à celle des États-Unis.
Ces chiffres démontrent non seulement l’importance du marché français pour les locations de courte durée, mais aussi l’efficacité potentielle de notre outil pour les hôtes et les gestionnaires de propriétés en France.
Comment utiliser PriceLabs pour maximiser son chiffre d’affaires
A l’occasion du lancement de la version française de notre platforme, nous avons dédié un webinaire aux questions récurrentes sur liéés au marché des locations touristiques, saisonnières et de courte durée.
Expérience de travail avec des hotes et concierges utilisant PriceLabs en France, au Québec, en Suisse, au Maroc et au-delà:
Rejoignez notre discussion animée par Romain avec les contributions de Marie. Nous partagerons notre expérience de travail avec les hébergeurs et les prestataires francophones. Découvrez comment PriceLabs collabore avec les professionnels de l’industrie en France et dans d’autres pays francophones, ainsi que les similitudes et les différences avec d’autres marchés.
Comment regarder et s’adapter aux grands événements et manifestations:
Dans cette partie, nous aborderons la manière dont PriceLabs vous permet de surveiller et de vous adapter aux événements. Thibault vous présentera les différentes perspectives, y compris les grands événements à venir comme la Coupe du Monde de Rugby 2023 et les Jeux Olympiques 2024. Marie partagera des cas concrets d’adaptation pour deux annonces spécifiques, dont une pour les Jeux Olympiques à Paris et une pour le match de rugby France-Italie à Lyon.
Comment utiliser PriceLabs en français
Notre interface utilisateur en français est simple et intuitive. Que vous soyez un hôte Airbnb individuel ou un gestionnaire immobilier en charge de plusieurs propriétés, l’utilisation de Price Labs en français peut vous aider à améliorer vos performances.
Comment faire passer la langue de l’anglais au français :
- Cliquez sur le cercle rouge montrant vos initiales d’utilisateur (exemple: TM) dans le coin supérieur droit de votre navigateur.
- Cliquez sur Settings (Paramètres).
- Faites défiler vers le bas jusqu’au choix de langue (“Language Preference”).
- Le paramètre par défaut est l’anglais.
- Cliquez sur “English” pour ouvrir le menu déroulant.
- Sélectionnez French (français).
- L’interface passe automatiquement au français.
- À tout moment, vous pouvez revenir à l’anglais
Conclusion
Retour sur notre engagement
Le lancement de la version française de PriceLabs est une véritable affirmation de notre engagement à servir les marchés francophones. Nous sommes déterminés à offrir à nos utilisateurs une expérience utilisateur optimale, quelle que soit leur langue ou leur localisation.
Invitation à essayer et à partager vos retours
Nous vous invitons à essayer notre version française et à partager avec nous vos retours. Votre satisfaction est notre priorité et nous sommes toujours prêts à prendre en compte vos suggestions pour améliorer notre produit.
The post PriceLabs en français – Chiffres France 2023 appeared first on PriceLabs .
]]>The post June product updates: Upgraded Min Stay Profiles, Multi-Calendar Page & Market Dashboards appeared first on PriceLabs .
]]>PriceLabs’ Improved Minimum Stay Profiles: Boost Occupancy, Maximize Revenue, and Avoid Costly Errors
1. The Impact of Well-Managed Minimum Stay Settings
Well-managed minimum stay restrictions can profoundly impact your property rental business. They allow you to:
- Increase Occupancy Rates
Setting minimum stays allows you to fill your calendar more efficiently, reducing unoccupied gaps and maximizing occupancy. It ensures that your property isn’t left vacant for extended periods, resulting in a higher return on your investment.
- Boost Revenue
Extended stays usually equate to higher total revenue per booking. By encouraging longer bookings, you increase your average revenue per guest, which can significantly improve your bottom line.
- Avoid Costly Mistakes
Proper minimum stay settings can prevent undesirable situations, such as accepting a one-day booking that blocks a potentially longer stay during the high season. By strategically setting your minimum stays, you ensure your property is reserved for the most profitable bookings.
2. Leveraging PriceLabs’ Min Stay Profiles
Introduction to Min Stay Profiles in PriceLabs
- In PriceLabs, Minimum Stay Profiles, often shortened to Min Stay Profiles, are pre-defined sets of rules that determine the minimum number of nights a guest can book your property for a given period.
- These profiles allow hosts and property managers to customize their minimum stay requirements based on various factors, such as the day of the week, time of year, or the number of days in advance of the booking.
- By creating and using Min Stay Profiles, you can optimize your booking strategy for different situations. For instance, you might have a profile for the peak season with higher minimum stays to ensure longer bookings, while during the low season, you may want to lower your minimum stay requirements to attract more potential bookings.
Benefits of using Min Stay Profiles
Using Minimum Stay Profiles can provide multiple benefits to users, especially those managing multiple listings or a variety of seasons. Here are some benefits:
- Flexibility: Minimum Stay Profiles allow users to customize minimum stay settings according to specific needs, conditions, or seasons. This flexibility is essential when dealing with different types of listings or varying seasons, as the ideal minimum stay may differ.
- Efficiency: These profiles save users time and effort by allowing them to apply certain settings across multiple listings, groups, or accounts with just a few clicks rather than making the same adjustments individually for each listing.
- Optimized Occupancy: With the ability to adjust the minimum stay dynamically, users can help optimize their bookings to reduce vacancy rates. For example, setting a longer minimum stay during peak seasons can ensure steady occupancy and higher revenue.
- Seasonal Adjustments: The feature of creating Minimum Stay Profiles from Custom Seasonal Profiles allows users to consider seasonal fluctuations. Different minimum stays can be set for off-peak and peak seasons, helping to maximize bookings and revenue during different times of the year.
3. New Ways to Create Min Stay Profiles
You now have three ways to create Min Stay Profiles. Here are the specific use case scenarios each method is best for:
- General creation of a Min Stay Profile:
This method is used when you want to create a Minimum Stay Profile that you can apply across different listings, groups, or accounts. The profile created in this way can be used as a general setting that can be applied wherever necessary. You can navigate to this by:
Navigation: Dynamic Pricing > Customizations > Min Stay Profiles tab > Create Profile
- New: Creation of a Min Stay Profile at a specific customization level:
This method is used when you’re customizing a particular listing or group and want to create a Min Stay Profile specific to this listing or group. The profile created here is applied directly to the listing or group you are working on.
Navigation: Preferred level of customization (Listing Level or Group Level) > Customizations > Stay Restrictions > Select a minimum stay profile info > Create a profile
- New: Creation of a Min Stay Profile while setting up a Custom Seasonal Profile: This method is used when you’re setting up a Custom Seasonal Profile and want to include specific minimum stay restrictions for this season. The profile created in this way is linked to that particular season.
Navigation: Preferred level of customization (Listing Level, Group Level, or Account Level) > Edit > Seasonal & Minimum Prices tab > Custom Seasonal Profile > Edit Profile > Add Seasonal Profile > Min Stay Profiles > Create Profile
Remember, the method you choose depends mainly on what level of customization you’re working at and how broad or specific you want your minimum stay restrictions to be.
4. Improved Min Stay Recommendation Engine: Detecting Seasonal Deviations to tell you when and how to create additional Min Stay Profiles
Our data-powered Min Stay Recommendation Engine now also detects and recommends minimum stay settings for specific months that do not follow the annual patterns:
- At PriceLabs, we’ve updated our recommendation engine to provide general annual minimum stay setting recommendations and identify and suggest adjustments for specific “exception” months that deviate from the typical annual patterns.
- When our system detects an exception for a specific month, the name of that month (e.g. July) is displayed at the bottom of the recommendations for the annual settings. By simply hovering your cursor over the name of this exceptional month, you can view the recommended minimum stay settings for that specific time period.
- This feature enhances the flexibility and accuracy of our tool, providing users with a nuanced view of their market dynamics. It enables them to tailor their minimum stay settings more accurately to the unique demand patterns of each month, improving revenue potential and guest satisfaction.
5. Keeping Your Min Stay Profiles Organized: The New Archiving Feature
In our ongoing effort to streamline and enhance the user experience, we’ve introduced a new feature to PriceLabs: the ability to archive Min Stay Profiles. This feature lets you manage your profiles more efficiently and keep your workspace neat and organized.
Introduction to the New Feature Allowing Users to Archive Min Stay Profiles
As you grow your property portfolio and adapt to market trends, you may find that some Min Stay Profiles become less relevant over time. However, instead of completely deleting these profiles, which could cause potential data issues, you can now archive them.
Archiving a Min Stay Profile is simple. You go to Dynamic Pricing > Customizations > Min Stay Profiles tab, and then click on the 3-dots icon to the right of the profile, and select ‘Archive’.
Even after a profile is archived, you can unarchive it if you need to use it again in the future. To unarchive a profile, click on the ‘Archive’ tab, and the archived profiles will appear. You can then click on the 3-dots icon to the right of the archived profile and select ‘Unarchive’.
The Rationale Behind Not Allowing the Deletion of Profiles
We have carefully decided not to allow the complete deletion of Min Stay Profiles. The reason for this is that each profile could be applied in many different places, and checking all those places before deleting could be cumbersome and prone to errors. This could lead to potential data conflicts and disrupt your existing settings. Archiving profiles instead of deleting them eliminates this risk.
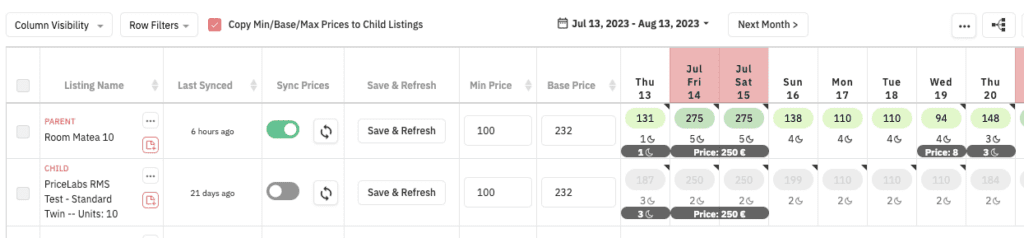
Simplified User Experience: Changes in the Multi-Calendar Page
At PriceLabs, our ongoing mission is to deliver the best possible experience for you. With this in mind, we’re excited to announce some changes to our Multi-Calendar page that have been designed to further streamline your navigation and usage.
Streamlining through Relocation
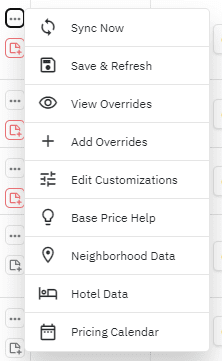
The ‘Customizations’, ‘Overrides’, and ‘More Actions’ columns have found a new home!
- You’ll now find these options conveniently located within the new editing menu, accessible via the three-dot icon.
- Key options like ‘Neighborhood Data’ and ‘Base Price Help’ have been moved to this new location for easier access.
A Focus on Clarity and Efficiency
We are taking additional steps to improve the clarity and efficiency of the Multi-Calendar page:
- The introduction of a context menu (three-dot menu) on every row offers a range of additional options.
- Removal of the ‘More Actions’, ‘View’, ‘Add Override’, and ‘Edit Customization’ columns. This move has been designed to minimize clutter and make operations smoother.
- The addition of the ‘Hotel Data’ option to the context menu, further enhancing the information accessibility.
Enhance Your Market Insights with our New 10,000 Listing Plan!
Our new Market Dashboard plan allows you to broaden your scope and deepen your understanding of the market with up to 10,000 listings for just $39.99 per month. Here’s why this could be a game-changer for you:
- Expanded Data: With 10,000 listings, you’ll have access to even more comprehensive insights, aiding in your decision-making process.
- Enhanced Market Analysis: Conduct a broader and more detailed analysis of potential markets and investment properties.
- Improved Pricing Decisions: More data means a more comprehensive understanding of pricing trends, helping you set the most competitive prices.
- More Nuanced Comparisons: Compare your performance against a larger pool of properties, giving you a more accurate understanding of your market position.
- Detailed Trend Analysis: Identify more complex trends and patterns to optimize your pricing, occupancy, and stay length strategies.
To upgrade, simply visit your Market Dashboard page and click on the vertical arrow symbol in the “Current Plan” column.
Upgrade your Market Dashboard for more data and insights
- If you’re currently on the 1,000 listings plan, upgrading to the 5,000 listings plan will only cost you $19.99 per month. You will be charged $19.99 now, with no further charges for this dashboard in the current billing cycle.
- If you’re currently on the 5,000 listings plan, upgrading to the 10,000 listings plan will cost you an additional $20 now, and then $39.99 per month from the next billing cycle onwards.
PriceLabs Integrates with HomHero, Hosty, LosjiTech, and ZAK Integrations: Expanding Possibilities
PriceLabs now integrates with four new Property Management Systems (PMSs), HomHero, Hosty, LosjiTech,, and ZAK , allowing their users to harness powerful dynamic pricing and revenue management alongside seamless functionality.
The post June product updates: Upgraded Min Stay Profiles, Multi-Calendar Page & Market Dashboards appeared first on PriceLabs .
]]>The post Discover PriceLabs’s Latest Enhancements: Base Price Nudges, Orphan Day Gap Filler, Improved Filters, and New PMS Integration appeared first on PriceLabs .
]]>———
The Next Frontier of Revenue Management: PriceLabs’s Game-Changing Nudges Framework – Introducing the Base Price Nudge
Nudges are small suggestions or prompts that help users take specific actions. At PriceLabs, we use nudges to make optimizing your pricing strategy a breeze. Our nudges are based on data and patterns, making it simple for you to make smart decisions and reach your revenue goals. For example, our first nudge focuses on Base Price – we’ll remind you to check it and suggest changes if needed. Using nudges will save time, make informed choices, and get better results for your listings.
What are nudges?
Nudges have gained popularity across various industries as a method to steer users toward better decisions. They encourage better choices by offering gentle reminders or suggestions.
In the fitness sector, nudges promote activity and healthy choices. For instance, Fitbit sends reminders to users to walk after periods of inactivity or celebrates their fitness achievements.
In the travel industry, tools like PriceLabs’s Nudges are similar to the “Opportunities” feature offered by both Booking.com and Airbnb. Opportunities assess a property’s performance, compare it to nearby properties, and provide tailored improvement suggestions, such as price adjustments, amenity additions, or description enhancements. Both Booking.com and Airbnb use Opportunities to nudge hosts to update their listings or provide discounts to attract more bookings.
How PriceLabs’s Nudges benefit users of all sizes
PriceLabs’s brand-new Nudges framework is a powerful tool that can be used to provide customized recommendations for every PriceLabs user across various revenue management metrics.
For example, for new hosts entering the industry, Nudges tackles the intimidating aspects of revenue management. It provides actionable advice that guides users toward manageable and impactful actions. These recommendations result in higher occupancy and revenue.
For revenue managers handling numerous listings, Nudges alleviates the challenge of staying on top of their portfolios. It pinpoints listings requiring attention and provides tailored advice based on unique characteristics. This automated assistance boosts efficiency, reduces effort, and enhances the bottom line.
Introducing PriceLabs’s First Nudge Feature: Effortless Base Price Recommendations
Understanding the Importance of Base Price:
Base Price is a crucial aspect of revenue management, as it sets the foundation for a listing’s price, significantly impacting occupancy and revenue. Properly adjusting the Base Price is essential for attracting bookings and optimizing revenue, but constantly reviewing and updating it to align with market conditions can be time-consuming.
Base Price Help: An Intelligent Solution for Setting Base Prices:
PriceLabs developed Base Price Help, a smart tool that recommends a Base Price for each listing based on market data, providing a solid starting point. This tool ensures tailored recommendations by analyzing nearby listings and considering factors like the number of bedrooms, listing performance, occupancy, and past base prices.
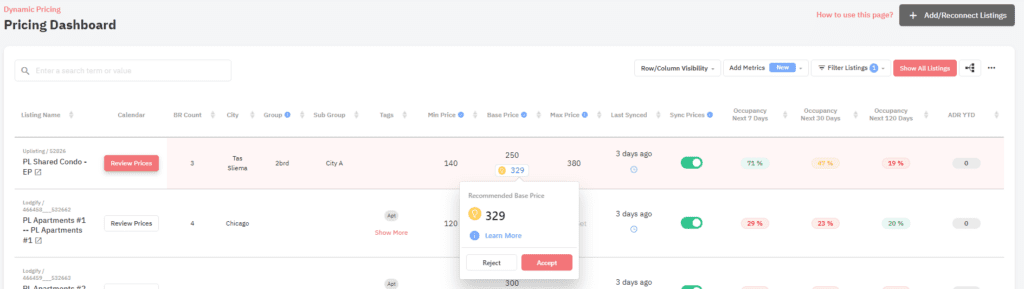
Introducing the Base Price Nudge:
While Base Price Help is effective, Nudges streamline the process, making recommendations more accessible and actionable. PriceLabs’s Nudges feature alerts users when a listing’s Base Price requires adjustment. If the current Base Price deviates by more than 5% from the recommendation, a nudge prompts users to realign with market conditions. This allows for easy review and acceptance of recommendations without manually checking each listing.
Check your nudges today
Nudges are a powerful way to help users reach their goals more effectively and efficiently. With PriceLabs’s innovative Nudges feature, users receive personalized recommendations based on data and patterns, simplifying the optimization of their revenue management strategy. By automating part of the process, Nudges saves users time and effort while achieving improved occupancy and revenue.
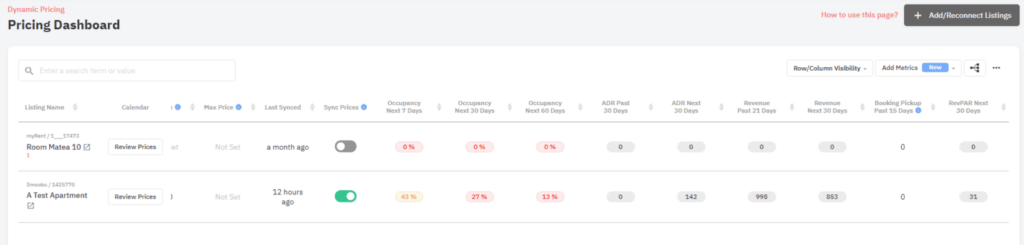
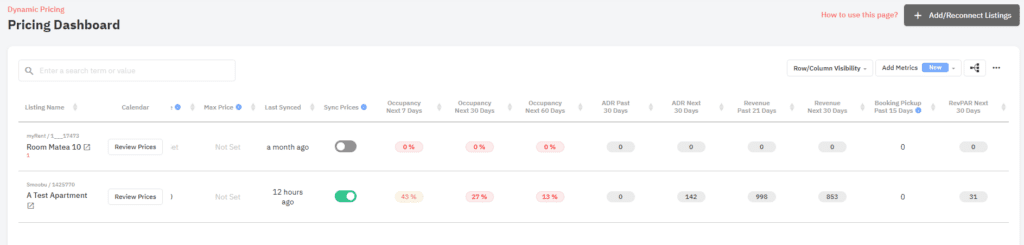
If you’re a vacation rental owner or short-term rental manager, we invite you to log into PriceLabs and check the Pricing Dashboard page for any Base Price nudges awaiting your attention. Reviewing and accepting these recommendations ensures that your listings are priced competitively and effectively, helping you attract more bookings and maximize your revenue.
————————–
Boost Your Bookings with the Orphan Day Gap Filler
Orphan Days: The Hidden Drain on Your Revenue
Short-term rental managers and hosts face the challenge of filling those pesky orphan days – the unbooked days between two reservations in a rental property. These gaps in the booking calendar can lead to lost revenue, as they often don’t align with the typical booking patterns of potential guests.
Orphan days can be of varying lengths, ranging from a single night to several days, making it difficult to establish a one-size-fits-all pricing strategy. As a rental property manager or host, you need a flexible, customizable solution that helps fill these gaps with attractive pricing for potential guests while maintaining profitability.
Say Goodbye to Vacant Days: Tackle Your Orphan Day Woes with our Gap Filler
Introducing the Orphan Day Gap Filler, a game-changing feature in PriceLabs that revolutionizes how you manage and optimize pricing for orphan days.
With this innovative tool, you can create multiple pricing rules based on the duration of the gap and the time range for which the pricing rule should apply. This customization is crucial because each gap length may require a different approach to encourage bookings. By setting multiple orphan day pricing rules for different gap durations, you can optimize your pricing strategies to accommodate varying guest preferences and booking patterns better, helping to minimize vacancy periods and maximize revenue.
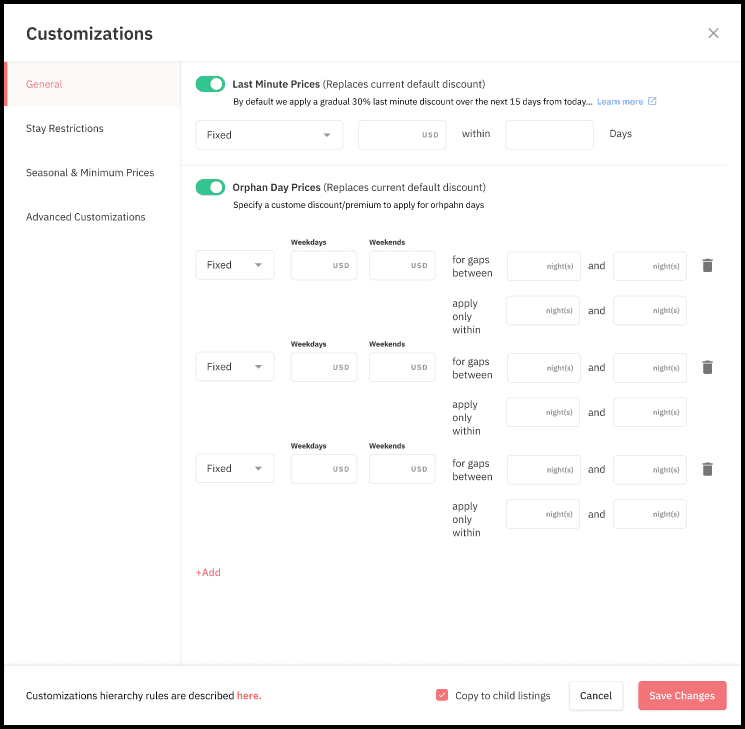
Orphan Day Pricing: An Example for Property Managers Who Prefer 4-Day Stays
A property manager has a rental property that typically welcomes 4-day stays. However, they have noticed a few orphan days shorter than their preferred minimum stay length. They want to encourage bookings for these shorter stays over orphan days, even if it means offering discounts for stays of 2 or 3 nights. Nevertheless, when it comes to 1-night stays, this property manager would only accept them for a premium over the expected night price to make up for the operational and cleaning costs. They use the Orphan Day Gap Filler to create pricing rules for different orphan gap durations.
Orphan gap: 1 night
- Rule: Apply a 20% premium
- Reason: The property manager is not a big fan of 1-night stays but would accept them for guests ready to pay a premium. The increased price could also compensate for the operational and cleaning costs.
Orphan gap: 2-3 nights
- Rule: Apply a 10% discount for both weekdays and weekends
- Reason: By offering a moderate discount, the property manager can make these gaps more attractive to guests looking for short stays or weekend getaways, encouraging them to book a minimum stay of 2 or 3 nights.
By setting orphan day pricing rules, the property manager can encourage bookings meeting their minimum stay preference while optimizing their pricing strategy for different types of orphan gaps. This approach helps to minimize vacancy periods and maximize revenue without compromising the manager’s desired minimum stay length.
With the Orphan Day Gap Filler, property managers can tailor their pricing strategy to meet the specific needs of their rental property and improve their overall booking performance.
————
PriceLabs Introduces Enhanced Listing Filters to Streamline Management Across Multiple Products
As a property or revenue manager, managing dozens of listings across different products and listing views on tools such as a PMS, a channel manager, an OTA, or dynamic pricing software can be tedious and time-consuming. PriceLabs understands these pains and is here with a solution.
Our listing filters have received significant upgrades, making them powerful, user-friendly, and, more importantly, present across multiple products like Review Prices, Multi-Calendar View, Portfolio Analytics, and the Manage Listings page, so you can work with ease regardless of which listing view you’re in.
With our enhanced filters, you can filter out options based on specific criteria, such as PMS name, city, group, sub-group, sync on or off, tags, and many more. Our filters enable you to quickly find what you need through our intuitive process and easily save it for future use.
So what are the benefits?
- Streamlined workflow: Our enhanced listing filters bring a more efficient workflow to your listing management process, saving you time and ensuring you’re working with the listings you need without the hassle of scrolling through irrelevant listings.
- More organization: The ability to filter out options based on specific criteria leads to better organization of your listings. Using group and sub-group filters, you can view listings that belong to a particular group or sub-group, making it easy to manage listings efficiently.
- Better decision-making: Our filters enable you to focus better, making it easier to make decisions and adjustments for your listings.

To find out how to create and save a filtered view, read our related Knowledge Base article.
Our enhanced listing filters are present across multiple products, making managing and analyzing your listings easier while saving you time. With the ability to build and save these filtered views, staying organized and efficient has never been easier. Try out our enhanced filters today and take the first step in unlocking efficiency in your property management!
————————-
PriceLabs is now integrated with a new PMS: Hosty
We’re thrilled to announce that PriceLabs has expanded its integrations to include a new Property Management System (PMS): Hosty. This exciting development allows its users to leverage the powerful dynamic pricing and revenue management capabilities of PriceLabs alongside the seamless functionality of Hosty. We aim to empower property managers and hosts with the best tools for maximizing revenue and streamlining operations. Don’t miss out on the benefits of these new integrations – explore them today!
The post Discover PriceLabs’s Latest Enhancements: Base Price Nudges, Orphan Day Gap Filler, Improved Filters, and New PMS Integration appeared first on PriceLabs .
]]>The post Unveiling the Improved Hotel Price Tracker and Exploring Effective Competitor Benchmarking in PriceLabs appeared first on PriceLabs .
]]>Bonus: We’ve also added new charts to our Pacing Reports. You will find details at the end of the article.
What’s happening: A third tab is now available on the Review Prices view.
Our PriceLabs team is happy to announce that you have a new section to help you make informed pricing decisions and stay competitive in the market: the Hotel Data tab. This new feature is available on the listing page alongside the Calendar and Neighborhood Data tabs.
To access these tabs, navigate to the Pricing Dashboard and select a specific listing. Then, click the “Review Prices” button to access the Calendar, Neighborhood Data, and Hotel Data tabs.
Calendar Tab: Unchanged.
The Calendar tab remains unchanged and displays a monthly calendar with the recommended prices for each night.
The Neighborhood Data tab still displays data from short-term rentals in the immediate area of your listing. However, we have moved the data about local hotels to the new Hotel Data tab.
Neighborhood Data Tab: Focus on Short-Term Rentals.
Hotel Data Tab: An Improved Hotel Price Tracker.
The new Hotel Data tab presents a new location for the Hotel Price Tracker and offers significant improvements. These include showing hotel prices based on different lengths of stay and the ability to view hotels on a map with star ratings.
With this powerful new analysis and tracking section, you can access even more valuable data to make informed pricing decisions and stay competitive. You will find further details about the Hotel Data tab in the remainder of this section.
Why effective benchmarking techniques are crucial for optimizing your pricing strategy.
In the dynamic and competitive world of short-term rentals, owners and managers like you must understand and leverage benchmarking principles to make informed decisions and stay ahead. This guide will discuss the importance of benchmarking, creating competitive sets for short-term rentals, and why looking at hotel data can provide valuable insights for pricing and length of stay strategies. By implementing these principles, you can optimize your property’s performance, revenues, and overall success in the market.
1.1. Key Principles of Benchmarking for Strategic Pricing
Benchmarking is a critical process that enables you to evaluate your property’s performance by comparing it with other properties in your local and hyper-local market. Understanding how well your property is doing in relation to competitors is essential for several reasons:
- Identifying Strengths and Weaknesses: Benchmarking helps you determine areas where your property excels or underperforms compared to others. By recognizing these strengths and weaknesses, you can make targeted improvements to your property and its offerings.
- Staying Competitive: Keeping track of competitor performance allows you to stay updated on market trends and ensures that you maintain a competitive edge. Adjusting your strategies based on this information can help you attract more guests and improve your property’s overall performance.
- Learning from Best Practices: By analyzing your competitors’ strategies and successes, you can identify best practices and innovative ideas to incorporate into your property’s management and marketing efforts.
- Setting Realistic Goals and Expectations: Benchmarking provides a realistic perspective on your property’s performance, which can help you set achievable goals and expectations for future growth and improvement.
- Optimizing Pricing Strategy: Comparing your property’s pricing with competitors can help you identify whether you charge too much or too little. Adjusting your pricing strategy based on this information can increase bookings and revenue.
To effectively benchmark, you need to create a comp set or a group of properties similar to yours in terms of location, size, amenities, and target market.
1.2. Creating Competitive Sets in the Context of Short-Term Rentals
“Comp sets” is short for “competitive sets.” These are groups of properties similar to you can compare your property’s performance. Creating comp sets involves selecting specific criteria to filter properties, generating a list of potential competitors, and then including or excluding properties to form a well-defined group.
You can create Comp sets for short-term rentals using various tools and platforms that offer filtering options based on location, property type, size, amenities, and other relevant factors. It helps you discover local competitors that closely match your property’s characteristics.
Creating comp sets has several advantages:
- Discovering Local Competitors: Comp sets help you identify other properties in your area that are similar to yours and target the same market. Thus, you can understand your competitive landscape and make better-informed decisions about your property’s positioning and strategies.
- Tracking Performance: Once you have created a comp set, you can track the performance of these properties over time. It enables you to monitor how well your property is doing compared to others in the group and identify trends or changes that may impact your business.
- Customization: Creating comp sets allows you to include only properties that are truly comparable to your own. It ensures that the performance data you track is relevant and meaningful. For instance, you could compare your property to others with a similar target market or positioning, which can provide valuable insights into your niche.
- Benchmarking: Comp sets enable you to measure your property’s performance against that of similar properties. It can help you identify areas where your property is underperforming and make targeted improvements to boost your competitiveness.
By creating comp sets tailored to your short-term rental property, you can better understand your competitive landscape and make data-driven decisions that can improve your property’s performance and profitability.
1.3. Why Looking at Hotel Data Makes Sense, Even for Short-Term Rental Managers
A key aspect of good benchmarking is taking a step back and considering the relevant market definition from your guests’ perspective. For instance, if you own a luxury 1-bedroom villa that offers concierge services, your competition will likely include 5-star hotels in your area.
In some markets, businesses offering short-term accommodations, such as apartments or aparthotels, might compete directly with nearby hotels. These businesses want to know how hotel prices change in their area, as hotel owners might have more information about local events or busy times. Additionally, some of PriceLabs’ customers own hotels and find this information helpful.
As a short-term rental manager, incorporating hotel data into your analysis can enhance your pricing strategy in several ways. For example,
- Understand pricing trends: By analyzing hotel pricing trends in your area, you can identify patterns that may impact your rental pricing. For instance, if hotel prices tend to increase during a specific period, consider adjusting your rental rates to match the demand.
- Identify high-demand periods: Hotel occupancy rates can give you a good idea of when your area is experiencing high demand for accommodations. You can use this information to adjust your minimum length of stay requirements and pricing during these periods to maximize revenue.
- Determine off-peak discounts: By analyzing hotel data during off-peak seasons, you can determine the appropriate level of discounting for your rental to attract bookings while maintaining profitability.
- Assess local events and their impact: Hotel data can provide insights into the impact of local events on accommodations. You can use this information to adjust your pricing and length of stay requirements during these events to maximize bookings and revenue.
- Monitor changes in the market: Keeping an eye on hotel data can help you stay informed about changes in the market, such as new hotel openings or closures, which might affect the demand for rentals in your area.
By considering data from various property types, including hotels, you can gain valuable insights into your local market, allowing you to make informed pricing decisions and stay competitive. In addition, this broader perspective ensures that you are accounting for all potential competitors in your area, helping you maintain an edge in the market.
Benchmarking hyper-local short-term rental competition with the Neighborhood Data tab
This section provides a quick overview of how the Neighborhood Data tab can help you stay updated on your local market and make well-informed pricing decisions for your short-term rental. We invite you to explore the related article in our Knowledge Base for a detailed explanation.
The Compare Competitor Calendar feature, an invaluable tool within the Neighborhood Data tab, lets you directly compare your pricing and availability with up to 10 specific listings in your neighborhood. By selecting the listings and clicking the “Get Calendar” button, you can view your competitors’ rates and adjust your pricing strategy accordingly.
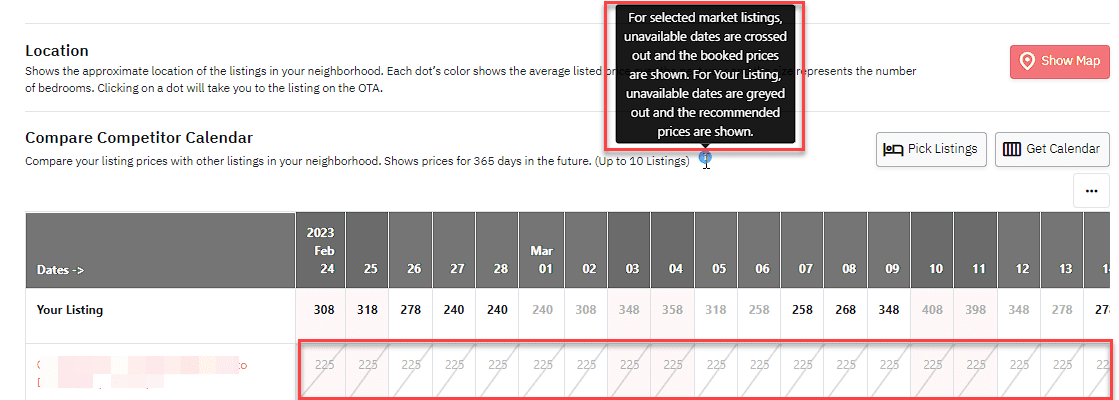
The Neighborhood Data tab offers two data sources for analysis: Nearby Listings and Market Dashboard. These sources help you understand your relative positioning in the immediate vicinity and across a broader range of properties, capturing a more extensive market snapshot. This larger set includes listings that may share similar characteristics or cater to your property’s target audience, providing a comprehensive perspective on the competition.
- The Nearby Listings option compares your listing to similar properties in the immediate area. This data helps you determine the average price for your location, compare your pricing strategy with nearby competitors, and make necessary rate adjustments.
- The Market Dashboard option allows you to benchmark against a customized market. To use this option, you must create a Market Dashboard and import this market view with the Neighborhood Data tab. It enables you to compare your property against a market that may differ from the hyper-local market provided by the Nearby Listings, offering a more tailored competitive analysis.
In summary, the Neighborhood Data tab equips you with vital information on local market trends, competitor pricing, and occupancy rates, empowering you to make well-informed pricing decisions and maintain competitiveness in the market.
How to track hotel prices in your local market competition with the Hotel Data Tab
PriceLabs’ Hotel Data tab is a powerful tool designed to help short-term rental managers stay competitive in their local market by tracking their competition’s pricing and length-of-stay strategies. While the tab is named Hotel Data, it contains valuable data for other property types such as bed and breakfasts, inns, serviced apartments, boutique hotels, and camping grounds. In this section, we’ll show you how to create a list of nearby hotels and other properties competing with your short-term rental and how to use the Hotel Data tab to analyze their pricing strategies. By the end of this walkthrough, you’ll have the tools you need to make data-driven pricing decisions and stay ahead of the competition.
Walkthrough: PriceLabs’ Hotel Data Tab
PriceLabs’ new Hotel Data tab offers two key sections to help analyze your competition: the Hotel Tracker and the Map View. These sections provide essential data insights into nearby hotels’ pricing strategies, location, and star ratings.
Hotel Tracker: Analyzing Nearby Competing Hotels to Maximize Revenue
This feature, located within the new Hotel Data tab, is designed to help you stay competitive in your market by providing valuable data on nearby competing hotels. The Hotel Tracker feature has three components:
- Select Hotels:
This feature lets you select up to 350 hotels in your neighborhood to compare with your listing. In addition, you can see the nightly rates for each hotel and adjust your pricing strategy accordingly.
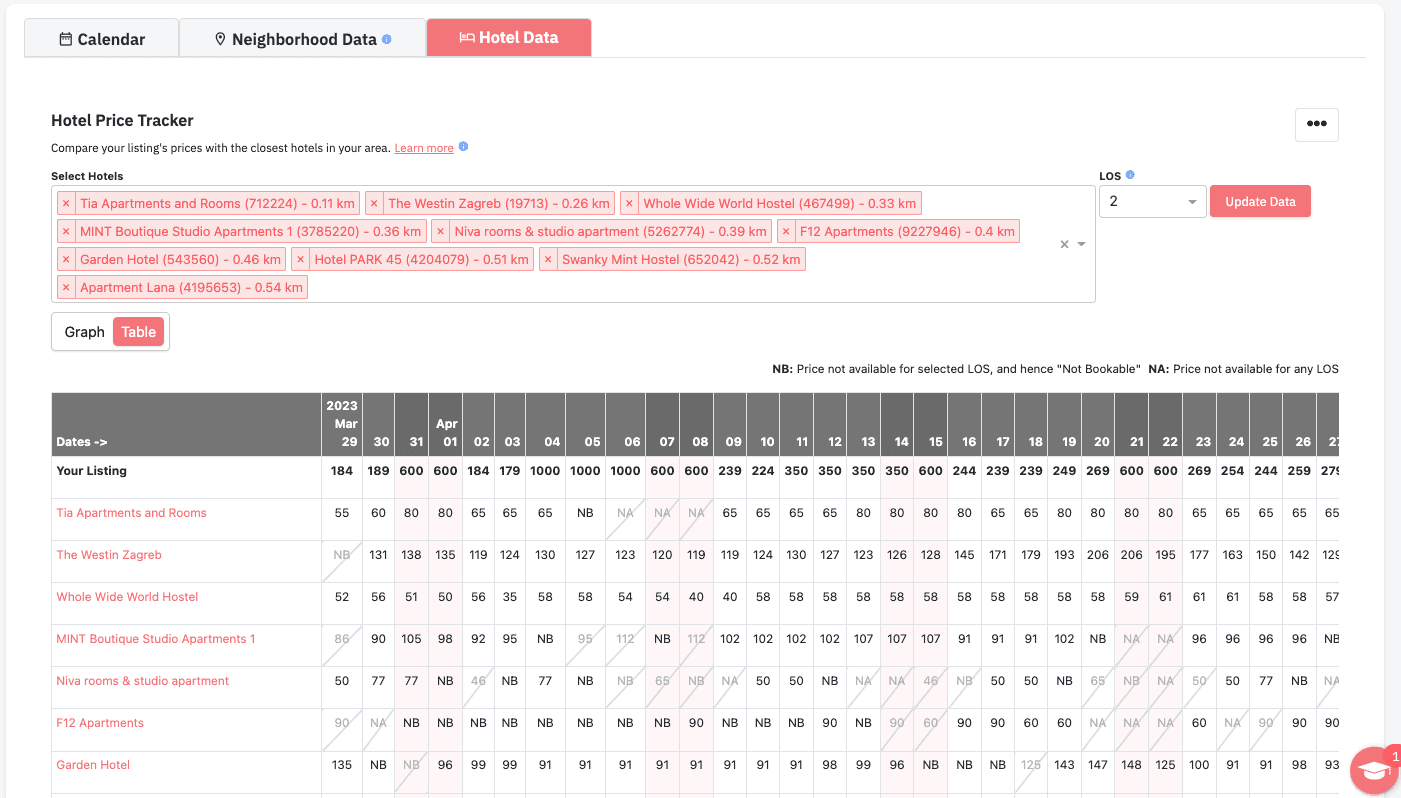
2. Length of Stay filter:
The LOS (Length of Stay) filter in the Hotel Data tab allows you to understand how nearby competing hotels price their accommodations based on the length of stay. This data can provide insights into adjusting pricing strategies for your property to stay competitive.
For example, suppose the LOS filter shows that a hotel offers a discount for a minimum stay of 3 nights. In that case, consider offering a similar discount for bookings of 3 nights or more to stay competitive. On the other hand, if a competing hotel charges a premium for shorter stays, you could consider offering a better value for guests who stay fewer nights.
Additionally, the LOS filter can help you determine the minimum stay requirements for nearby hotels. For instance, if many hotels in the area have a minimum stay requirement of 3 nights, you may want to adjust your minimum stay requirement to match or exceed that standard.
Overall, the LOS filter provides valuable data on how nearby hotels price their accommodations based on the length of stay. As a result, it can help you make informed decisions on your pricing strategies and stay competitive in the market.
3. The Table & Graph View
The Table & Graph View in the Hotel Data tab is essential for analyzing your pricing strategy. In addition, the view allows you to compare your pricing position with nearby competing hotels.
The Table View displays the nightly rates of selected hotels for comparison. Your listing’s prices are highlighted in bold, while unavailable dates are crossed out and greyed. We use NB if the date is Not Bookable for the selected Length of Stay and rates are available for a different Length of Stay. We use NA if rates are Not Available for any length of stay.
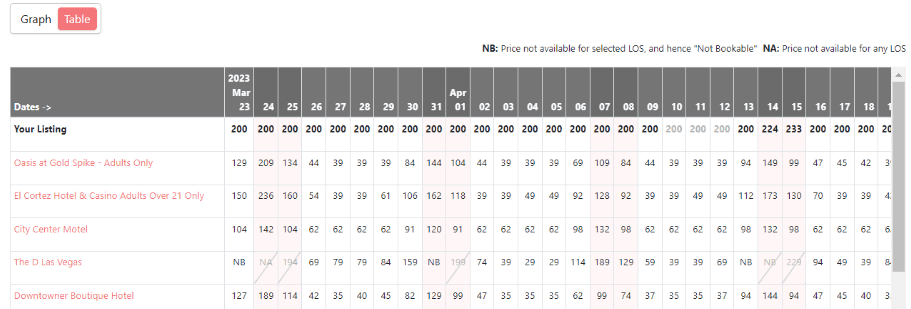
By clicking on a hotel name in the table, a link takes you to the hotel’s Booking.com page. The Graph View displays the pricing position of your property relative to nearby competing hotels over time. The black line represents the recommended price for your property by PriceLabs. The corresponding hotel line on the graph can be hidden or shown by clicking on a hotel name on the legend.
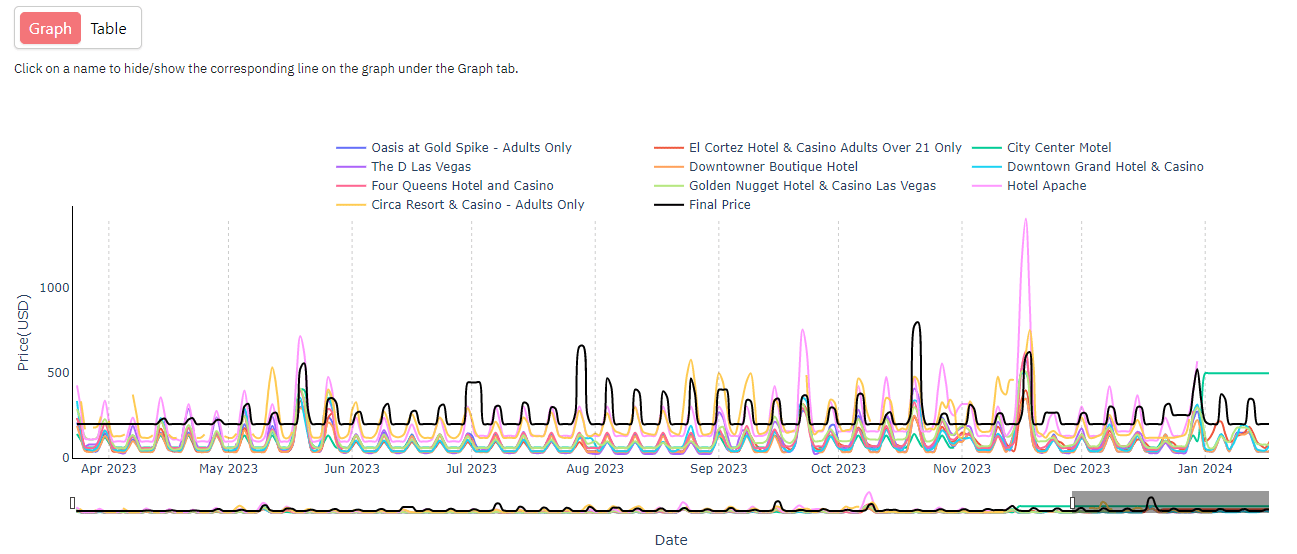
You can use this information to adjust your pricing strategy and stay competitive. For example, you can lower your prices if your property’s prices are consistently higher than nearby hotels or raise them if your prices are lower. Additionally, the Table & Graph View can help identify patterns in pricing strategies among nearby hotels, which can inform your pricing strategy.
Overall, the Table & Graph View component of the Hotel Tracker feature is essential for comparing your pricing position with nearby hotels, making informed pricing decisions, and staying competitive.
Map View: Visualize Nearby Hotels
The Hotel Data tab provides a unique feature called Map View. It visually represents nearby hotels in your neighborhood. This feature uses a color-coding system based on the star ratings shown on Booking.com to differentiate the hotels.
With the ability to zoom in and hover over each bubble to see the star rating, this feature offers a quick and easy way for short-term rental managers to understand the competitive landscape of their area.
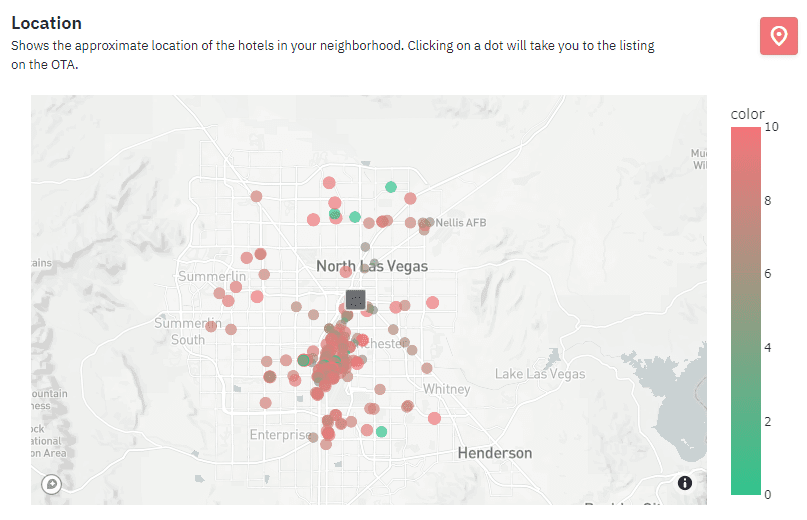
Your questions about PriceLabs’ new Hotel Data tab
From where does PriceLabs source its hotel data?
We obtain hotel data from Booking.com, the largest accommodation provider worldwide. PriceLabs retrieves information from Booking.com, such as hotel names, locations, rates, calendar availability, and star ratings.
Does the hotel data affect the price recommendations provided by PriceLabs?
The impact of hotel data on PriceLabs’ pricing recommendations can vary depending on the market and circumstances. For example, we may incorporate relevant hotel data into our pricing algorithms in some markets where hotel trends can predict short-term rental demand. Additionally, when short-term rental data doesn’t show demand signals for events many months out, we may use hotel data as an additional indicator to inform our pricing recommendations.
Refined Pacing Report Tab: Introducing New Data Points & Comparative Metrics
We are excited to announce the latest improvements to our Pacing Report tab launched just last month. These updates will help you better understand your property’s performance and make informed decisions.
In the “Pacing” section of the Pacing Reports, we have introduced additional data points and curves, providing a more comprehensive and insightful analysis. Here’s what’s new:
| Chart Type | New Chart Description | Benefit |
| Occupancy Charts | Your Occupancy (last year final) | For a comparative analysis of your occupancy rates |
| Market Occupancy | Provides insight into your market’s current occupancy rates. | |
| Average Daily Rate (ADR) Charts | Your ADR (last year’s final) | Compares your average daily rates from the previous year. |
| Average Daily Rate (ADR) Charts | Market ADR | Provides insight into your market’s current average daily rates. |
| Average Daily Rate (ADR) Charts | Market ADR (last year today) | Lets you compare the market’s average daily rates from the same date last year. |
| Revenue per Available Room (RevPAR) Charts | Your RevPAR (last year’s final) | Enables you to evaluate your revenue per available room compared to the previous year. |
| Revenue per Available Room (RevPAR) Charts | Market RevPAR | Displays the current revenue per available room in your market. |
| Revenue per Available Room (RevPAR) Charts | Market RevPAR (last year today)” | Helps you compare the market’s revenue per available room from the same date last year. |
In conclusion, introducing the Hotel Data tab and the enhancements to the Pacing Reports provide PriceLabs users with a comprehensive set of tools to make well-informed pricing decisions and maintain a competitive edge in the market. These features offer valuable insights into nearby hotels and local short-term rental market trends and enable you to analyze your property’s performance more effectively. By leveraging these tools, you can optimize your pricing strategies, maximize revenue, and ensure they stay ahead of the competition.
The post Unveiling the Improved Hotel Price Tracker and Exploring Effective Competitor Benchmarking in PriceLabs appeared first on PriceLabs .
]]>The post Step Up Your Revenue Management with PriceLabs’ Enhanced Comp Sets and New Pacing Report (+ We’re in Spanish!) appeared first on PriceLabs .
]]>Here are the takeaways from this month’s updates.
- PriceLabs has improved its comp sets to provide better accuracy and revenue performance for properties.
- A new Pacing Tab in Portfolio Analytics enables comparing your performance against last year and the market. In addition, Booking Curves help you understand the build-up of key metrics
- As a reminder, pacing data is now available in Neighborhood Data, and Market Dashboards.
- Neighborhood Data now offers market pacing information for each listing.
- For those who don’t have a listing in a market of interest yet, Market Dashboards provide similar historical and pacing information.
- PriceLabs is now available in Spanish.
- Easier-to-read competitor data helps you stay ahead of the curve.
- Users of the Barefoot and Cloudbeds PMSs can now connect to PriceLabs.
Our upcoming live webinar is the perfect opportunity to learn more about these exciting new features and how they can benefit your pricing strategy. Register now for a detailed explanation of the updates and an opportunity to ask questions. Take advantage of this chance to take your pricing strategy to the next level with PriceLabs!
1. Refined Comp Sets Lead to Better Price Recommendations
We have made some changes to improve the accuracy and effectiveness of our comp sets, which has led to significant improvements in our Neighborhood Data tab and Dynamic Pricing product. We’ve focused on properties with a similar number of bedrooms to your listing. We refined the set of listings to compare your performance. This approach ensures that we offer more precise comparisons for your property.
This change has led to two significant enhancements:
- The Neighborhood Data tab now displays more comprehensive and relevant comparable data from similar-sized properties.
- This change has also been integrated into our Dynamic Pricing, further refining and improving our price recommendations.
Our team has already implemented these changes, and you can now benefit from their effects without taking any action.
2. PriceLabs gives you Pacing data at your finger’s touch – in Portfolio Analytics, Neighborhood Data, and Market Dashboards.
In 2023, the short-term rental market may seem daunting. Yet, PriceLabs has introduced new pacing curves and data to make the process easier for hosts and managers. These additional features offer valuable insights and tools that allow users to stay ahead of the competition, optimize rates, and maximize revenue.
Moreover, these features are included in every PriceLabs’ dynamic pricing and market report products at no extra cost to current users. For those not yet using PriceLabs, the free Portfolio Analytics product is worth considering as it provides access to pacing data for their market without extra cost. This presents an excellent opportunity to see how pacing can benefit their business.
Our data science team diligently works behind the scenes to improve the data quality, cleansing process, and integration into our tools. This is often done without any explicit announcement, but it results in better analysis, forecasting, and pricing predictions for you.
2.1. A redesigned Portfolio Analytics page
Our redesigned Portfolio Analytics page offers valuable insights into the performance of your rental listings. With two tabs – “KPIs and Historic Reports” and “Pacing Reports” – you can get a real-time comparison to last year’s data and market trends. Additionally, our new Booking Curves feature allows for visualizing booking trends over time. These powerful analytics tools support informed decision-making and can drive the success of your hospitality.
Let’s explore the new Pacing tab
With the Pacing tab, you can now compare your current performance to the same period last year and how the local market is doing. It will help you stay up-to-date on your progress and make informed decisions for your rental business.
Compare Your Performance to Last Year
The new Pacing tab allows users to compare their listings’ performance from this year with the same period last year. This feature shows three graphs for Occupancy, ADR (booked), and RevPAR. Each chart displays how selected listings are currently performing compared to their performance on the same day last year.

Compare Your Performance Against the Market
If you’ve purchased one or several Market Dashboards, you can select them in the Pacing tab to compare your listings’ performance against the market. This feature adds last year’s and this year’s market occupancy to the Occupancy graph. Additionally, the Listed Price graph displays market prices for the next six months.
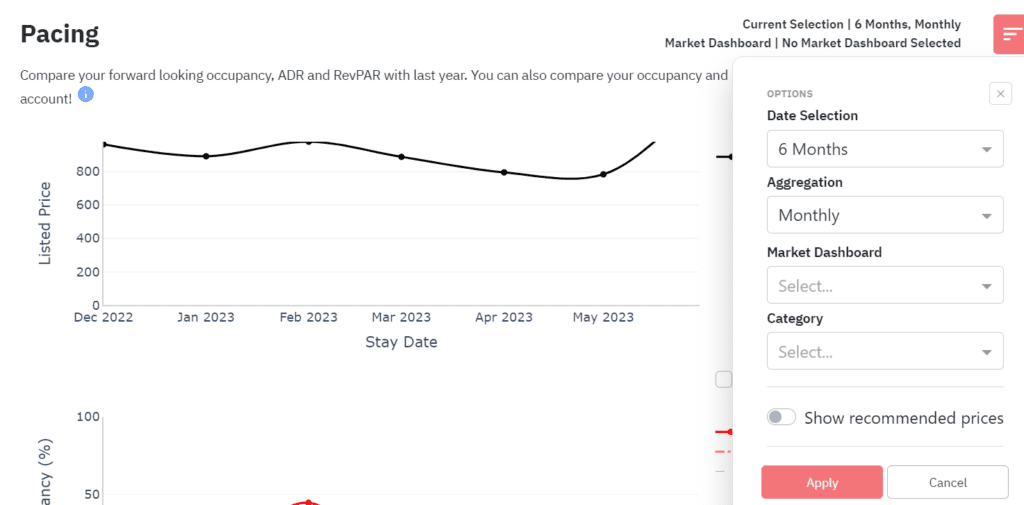
Booking Curves: Analyze Changes and Visualize Booking Evolution
The recently launched “Booking Curves” feature is entirely new and provides an overview of the evolution leading up to the current state. This feature allows customers to visualize how specific changes they made might have influenced bookings and when some factors were beyond their control.
For instance, the default view displays the revenue, occupancy, ADR, and RevPAR for upcoming months. Additionally, users can customize date ranges based on their preferences. Those interested in year-over-year analysis can select the custom dates option.
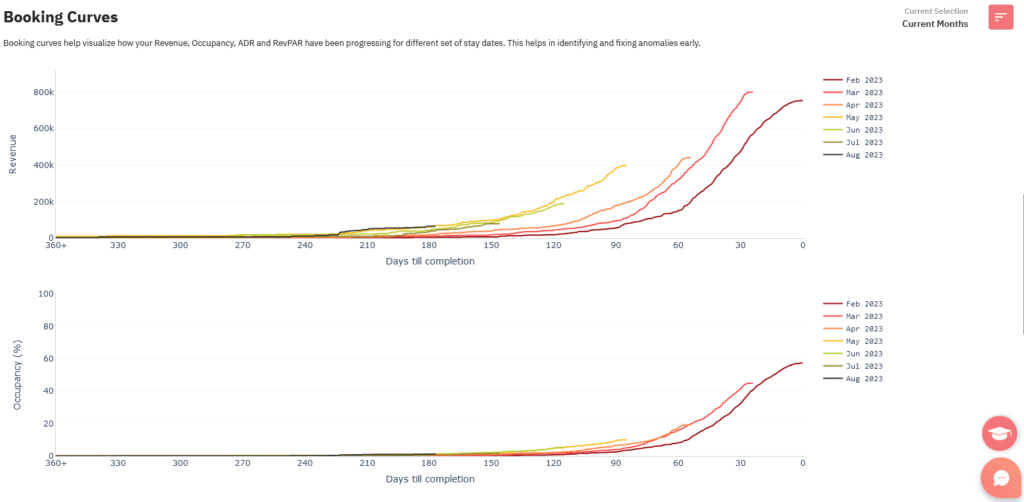
2.2 More pacing information for each of your listings within Neighborhood Data
Within the Neighborhood Data tag, the Future Occupancy Chart helps you visualize the occupancy trends in your area. It displays the average occupancy for each date over the next year in grey and any blocked dates for your listing in red.
To further assess how your listing is performing, you can now choose to view additional pacing curves on the chart.
- The first set of curves shows last year’s market occupancy, with the “Last Year Today” curve indicating the occupancy on the same day last year and “Last Year Final” revealing the previous year’s final occupancy. These curves provide insights into whether bookings are coming in slower or faster than last year.
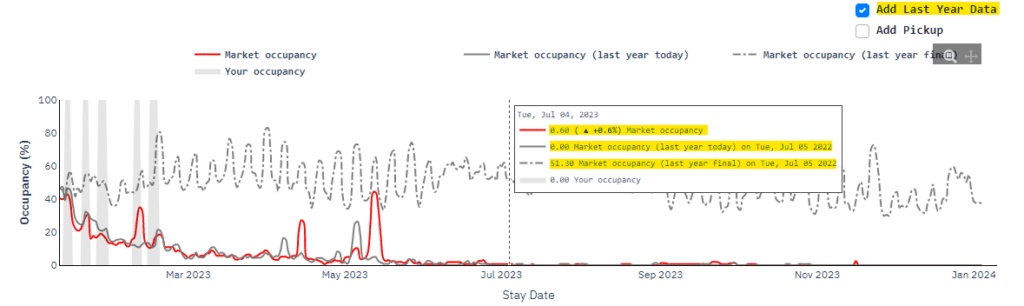
- The second curve, called Pickup, shows how many bookings were made in the market during the last 7 days for each day on the graph.
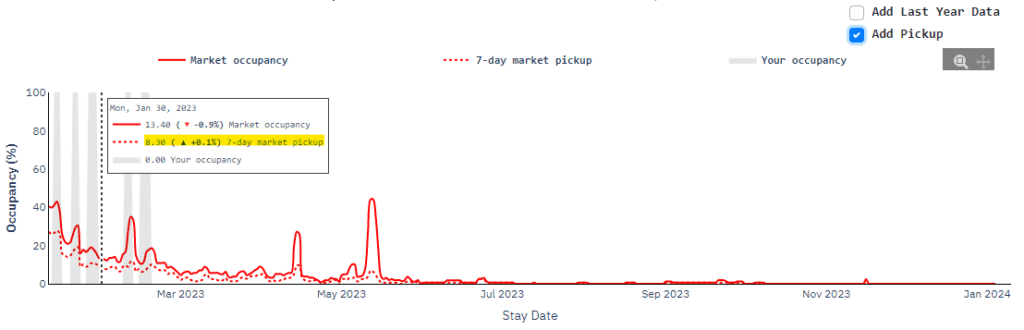
2.3 More historical market data in Market Dashboards
We have recently introduced a new feature to our Market Dashboards that allows users to compare current market trends with those of the previous year. It helps identify any potential slowdowns in a specific market, regardless of whether or not you have a listing in that area (unlike with Neighborhood Data).
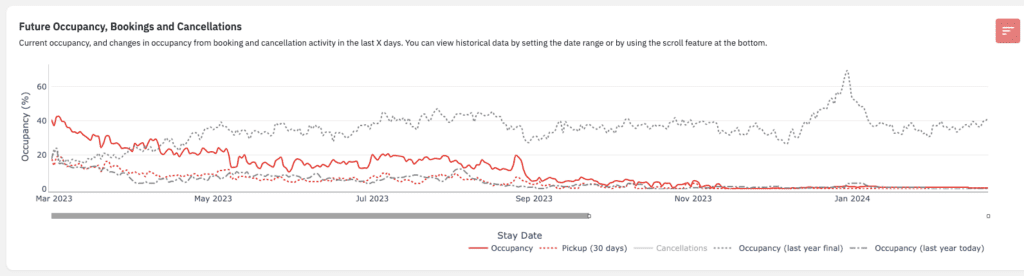
For example, in the “Future Occupancy, Bookings and Cancellations” graph, we offer additional curves such as Occupancy Last Year Today and Occupancy Last Year Final. These curves provide valuable insights into whether bookings are coming in slower or faster than last year.
Users of the Market Dashboard could already include the 30-day pickup curve on the “Future Occupancy, Bookings and Cancellations” graph. This curve displays the number of bookings made in the market over the past 30 days for each day represented on the chart.
3. PriceLabs is available in Spanish!
PriceLabs has recently launched a Spanish-language version of its dynamic pricing and revenue management software for the hospitality industry. This localized version will enable users in Spanish-speaking countries to understand better and use the product.
The result is increased host revenue, improved job performance for property management company employees, and a better user experience for everyone involved. PriceLabs is proud to offer this new feature that caters to a broader audience, allowing them to benefit from their innovative software.
Today, you can take action to change the default language of PriceLabs from English to Spanish. (Note that you can do it later or revert to English anytime).
Here’s how to do it:
- Click on the red circle with your user initials in the top right corner of your browser.
- In the dropdown menu, click on Settings.
- In the Profile Settings page, scroll down to Preferred Language.
- By default, the choice is English.
- Click on “English” to open the dropdown menu. Select “Spanish”.
- The interface will automatically switch to Spanish.
- At any time, you can come back here to revert to English.
4. Clearer Neighborhood Competitor Analysis
In the Neighborhood Data tab, you can select and handpick listings that directly compete with yours. Once you have made your selections, you can view your competitor’s prices and availability for each listing in the “Compare Competitor Calendar” table.
We’ve just made it easier to read this table. Unavailable dates are now crossed out, and the price displayed is the “booked price,” which is the last seen price when the date was available. These changes make it simpler to compare your prices and availability against your competitors quickly.
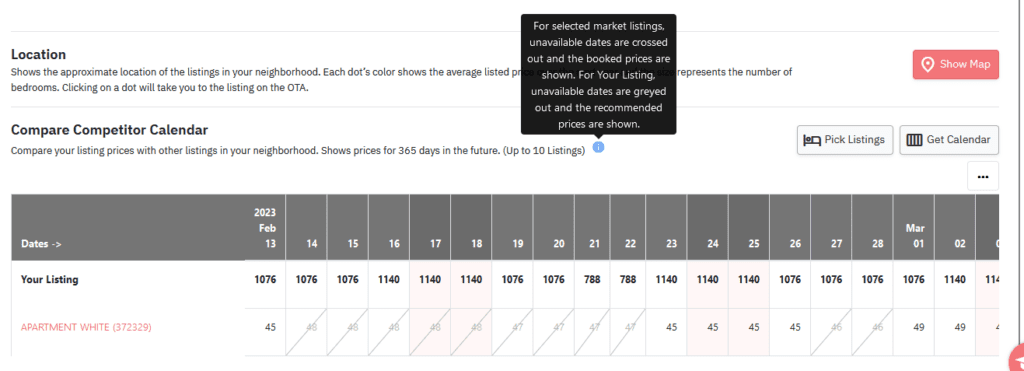
5. PriceLabs welcomes more PMS users!
Barefoot x PriceLabs
With the integration of PriceLabs and Barefoot Technologies, users of the Barefoot PMS can now benefit from dynamic pricing and advanced revenue management features.
This integration allows users to automate their pricing strategy and adjust rates in real time based on demand, seasonality, and other factors.
Additionally, users can access PriceLabs’ extensive data analysis tools to gain insights into market trends and optimize their revenue performance. This powerful combination of Barefoot and PriceLabs allows vacation rental managers to maximize their profits while minimizing the effort required to manage prices manually.
Cloudbeds x PriceLabs
We are thrilled to announce that the integration between PriceLabs and Cloudbeds is now live! If you manage a hotel, hostel, bed & breakfast, or short-term rental using Cloudbeds, you can now access PriceLabs’ innovative, dynamic pricing and revenue management solutions.
PriceLabs is an ideal choice for Cloudbeds users since it offers a comprehensive solution that caters to all hospitality professionals, ranging from hoteliers and Airbnb hosts to vacation rental managers and hostel operators. Regardless of their needs, PriceLabs has Cloudbeds users covered.
Don’t miss out on learning more about PriceLabs’ recent updates and how they can benefit your pricing strategy. Register for our live webinar now to reserve your spot and get a detailed explanation of the new features and an opportunity to ask any questions you may have. Join us and take your pricing strategy to the next level with PriceLabs!
The post Step Up Your Revenue Management with PriceLabs’ Enhanced Comp Sets and New Pacing Report (+ We’re in Spanish!) appeared first on PriceLabs .
]]>The post PriceLabs’ Pacing Reports: The Key to Researching Short-Term Rental Markets for 2023 Predictions appeared first on PriceLabs .
]]>How will 2023 pan out? PriceLabs’ pacing reports let short-term rental operators research their markets in minutes
(Chicago; IL – February 28, 2023) Navigating the uncertain short-term rental market of 2023 can be intimidating–but it doesn’t have to be. With its new pacing reports, PriceLabs provides hosts and managers with the insights and tools they need to stay ahead of the competition, optimize rates, and maximize revenue. With these innovative features, hospitality pros get up-to-date analysis on local markets and comparative insight into their performance versus last year –all included in each of PriceLabs’ dynamic pricing and market report products at no extra cost to current users. For those who are not current users, the Portfolio Analytics product is worth trying as it is free forever. This feature allows access to pacing data for their market without any cost. It’s a great opportunity to see how pacing can benefit their business.
Why Analyzing Performance is Key in 2023 for Airbnb Hosts and Short-Term Rental Managers: Comparing to the Market and Last Year.
Traditional vacation rental markets saw an incredible surge in 2021 and 2022, but 2023 is different. Sea, mountain, and rural locations still thrive, but travelers are more price sensitive. Lake Tahoe’s winter tourism declined (-9%), but a slight increase (+6%) is expected for July 14-15. Wisconsin Dells’ bookings have remained stable, pacing ahead of 2022 (+7.5%). Cities are experiencing a resurgence in demand with varying recovery rates; Bordeaux, France, is an example, with a decline from January to March (-2.5%), followed by a surge on September 9 (+28%), potentially due to a Rugby World Cup match.
Cities are experiencing a resurgence in demand, but the pace of recovery varies greatly between markets and seasons. For instance, in 2023, most European cities are surpassing their 2022 levels, with Bordeaux, France being a notable example. Although Bordeaux’s market experiences a decline from January to March (-2.5%), it picks up momentum throughout the year (+3%). It sees a surge on September 9 (+28%), potentially due to a Rugby World Cup match.
In response to these shifts, property managers and hosts comparative data to reduce uncertainty for their urban and non-urban short-term rental businesses.
Moreover, the #Airbnbust trend on social media indicates that some Airbnb hosts might see fewer bookings per listing than before; therefore, measuring current performance against the same period last year can help them determine if they are affected.
Fortunately, PriceLabs provides a solution through its pacing and historical comparison features, allowing hosts and property managers to measure their success against the local market and track changes in key performance metrics compared to their previous performance.
Analyzing and Optimizing Listing Performance with PriceLabs’ Pacing Tools.
Hosts and managers can take their revenue management strategy to the next level with Pacing – a feature now available within each of PriceLabs’ dynamic pricing and market report products.
Pacing is a powerful strategy for individual hosts and hospitality professionals that helps them maximize revenue and make informed decisions. The concept of pacing focuses on setting reference points, typically in the form of pacing curves.
With the aid of its industry-leading data science team, PriceLabs compiles and analyzes market data from sources such as Airbnb and Vrbo. This process provides unique insights into each short-term rental market, which are then presented as easy-to-read graphs and metrics.
Hosts and managers can now easily identify whether their listings, local competitors, or an entire market are slowing down or accelerating compared to last year. In addition, they can keep track of rates, occupancy, and reservations on forthcoming dates straight from each of PriceLabs’ industry-leading tools, Market Dashboards, Portfolio Analytics, and Neighborhood Data – all at no added cost for current users.
See how your listings are pacing today – for free.
Current PriceLabs users will immediately find the new pacing and historical tools available within Market Dashboards, Portfolio Analytics, and Neighborhood Data.
Other hosts and property managers can start a 30-day free trial at pricelabs.co. With the company’s flat-fee pricing model and lock-in contract, it is not risky. Access to the Portfolio Analytics and its pacing data stays free of charge, even beyond the trial period.
Contact
media@pricelabs.co
The post PriceLabs’ Pacing Reports: The Key to Researching Short-Term Rental Markets for 2023 Predictions appeared first on PriceLabs .
]]>The post PriceLabs’ Pacing Reports: The Key to Unlocking Success for Short-Term Rental Businesses in Fluctuating Markets” appeared first on PriceLabs .
]]>2023 short-term rental trends underline the need for pacing
In 2023, traditional vacation rental markets are seeing mixed results. Some locations, like Lake Tahoe, are experiencing a decline in winter tourism compared to last year, while others are pacing ahead for this summer.
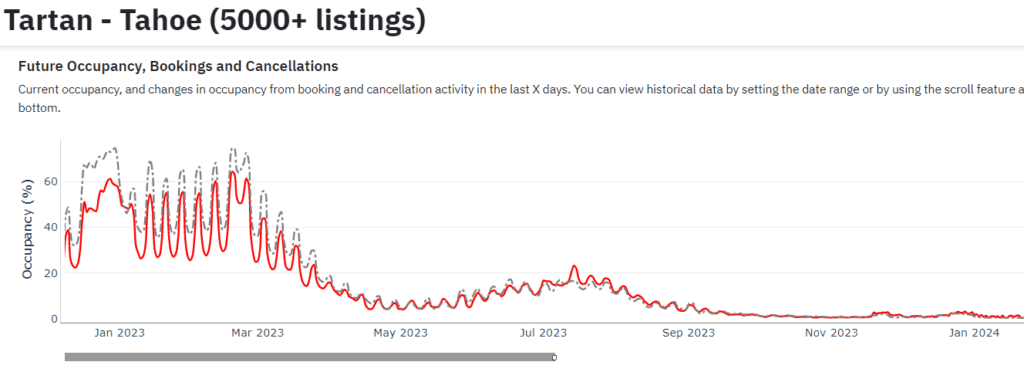
Cities are experiencing a resurgence in demand, but the pace of recovery varies. Nevertheless, most European urban centers surpass their 2022 levels, with Bordeaux being a notable example.
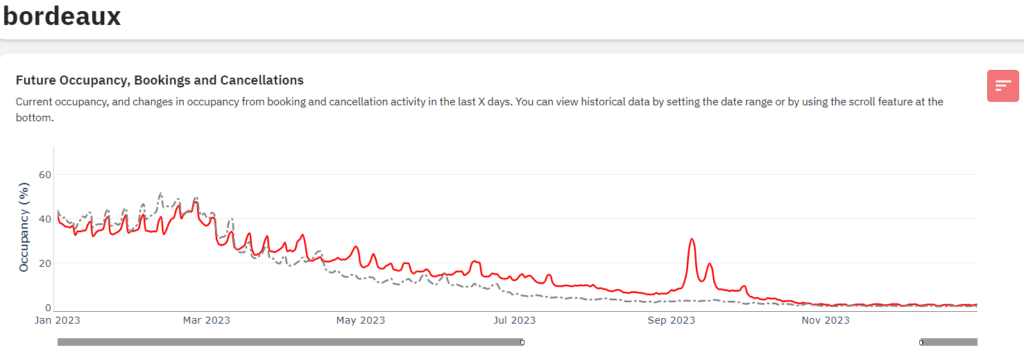
Property managers and hosts need reliable comparative data to reduce uncertainty for short-term rental businesses in these fluctuating markets. It’s where PriceLabs’ pacing tools come into play. With these new pacing data and graphs, hosts and managers can measure their success against the local market and track changes in key performance metrics compared to their previous performance.
Pacing is a powerful strategy that helps individual hosts and hospitality professionals maximize revenue and make informed decisions. With PriceLabs’ industry-leading data science team compiling and analyzing market data from sources such as Airbnb and Vrbo, hosts and managers can easily identify whether their listings or local competitors are slowing down or accelerating compared to last year.
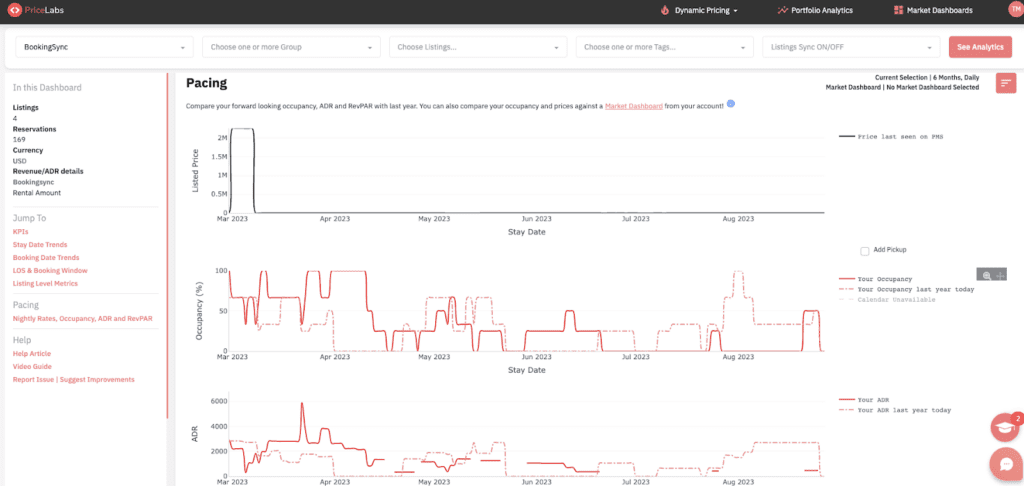
PriceLabs offers pacing reports within its Market Dashboards, Portfolio Analytics, and Neighborhood Data tools – all at no added cost for current users. And for those who aren’t current users, the Portfolio Analytics product is free forever. So it’s an excellent opportunity to see how pacing can benefit your business.
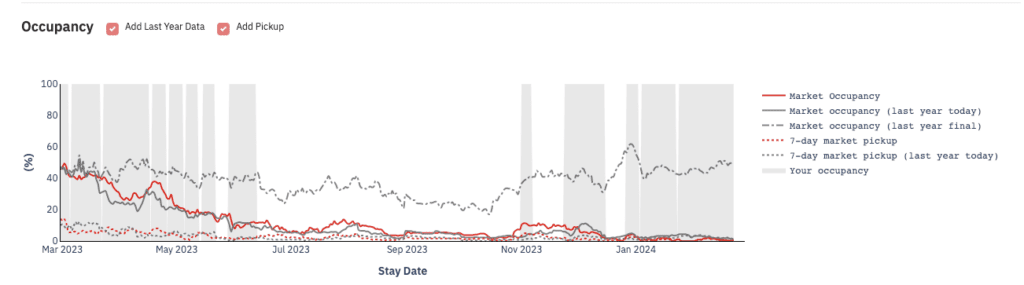
So if you want to take your Airbnb hosting or short-term rental managing game to the next level in 2023 – or any year – try out PriceLabs’ pacing reports today. With up-to-date analysis on local markets and comparative insight into your performance versus last year included in each of PriceLabs’ dynamic pricing and market report products at no extra cost to current users, there’s no reason not to give them a shot.
The post PriceLabs’ Pacing Reports: The Key to Unlocking Success for Short-Term Rental Businesses in Fluctuating Markets” appeared first on PriceLabs .
]]>