One of the most critical choices to make as an Airbnb host is your average Airbnb price. It’s a delicate balance between increasing occupancy rate and maximizing profitability. When it comes to pricing your vacation rentals, it’s crucial to understand the market dynamics. Numerous factors come into play, such as the type of rental, the neighborhood it’s located in, and even the time of year. To give you an idea, in December, the average Airbnb prices of a one-bedroom listing on Airbnb was $114. And in the last quarter of 2023, active listings saw an impressive 18% growth compared to the same period in 2022.
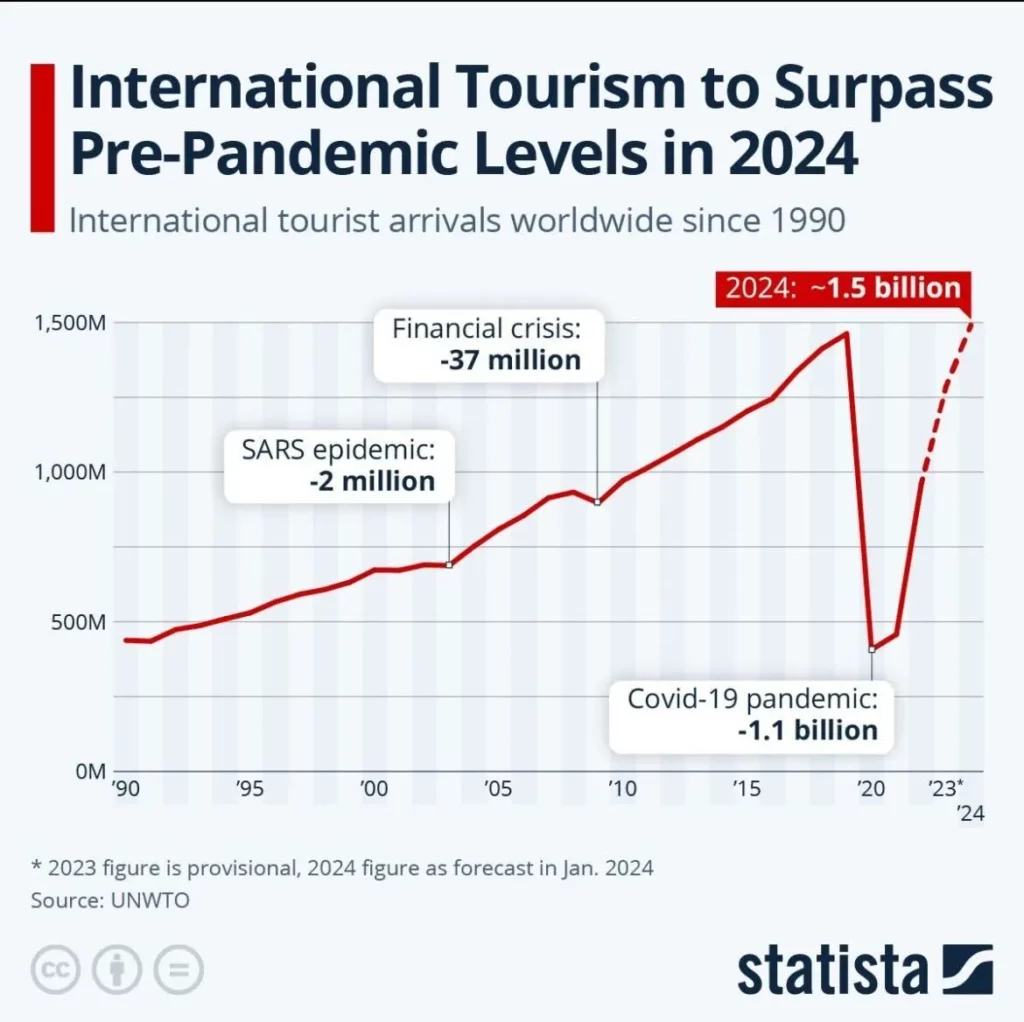
International tourism levels surpass pre-COVID levels, which means demand is increasing. People are traveling more than ever, and it is time to rethink your pricing strategy in light of the changing vacation rental landscape. Opinions shared by friends and family on social media carry significant weight. It has become important to instill confidence in travelers that they’re making the most of their budget – which is the second biggest frustration.
Your average Airbnb price should depend on Airbnb statistics based on city-data. As established above, your prices are the most critical aspect of your Airbnb strategy.
A few things you should keep in mind when deciding on your average Airbnb prices are:
Researching your market and guests: Examine how your market performs and understand your guests’ booking patterns.
Compare similar properties: Look at how similar properties have priced their property, what other amenities they have added, and how they attract their guests. This will help you craft a holistic pricing strategy.
Consider maintenance costs: You should consider cleaning and upkeep costs for your property. This includes cleaning supplies, labor costs, repairs, replacements, and insurance costs, even if Aircover is present.
Consider Dynamic Pricing: Dynamic pricing helps you stay competitive in the market by automatically adjusting your average Airbnb prices according to supply and demand fluctuations.
What Are The Average Airbnb Prices Per City In The USA?
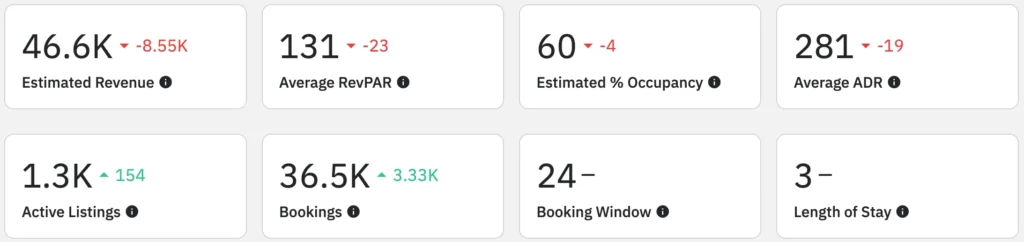
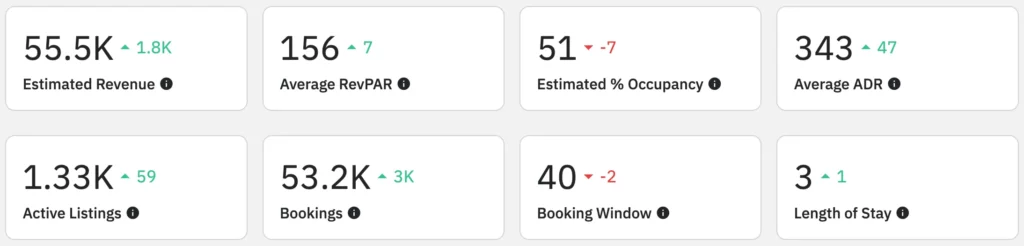
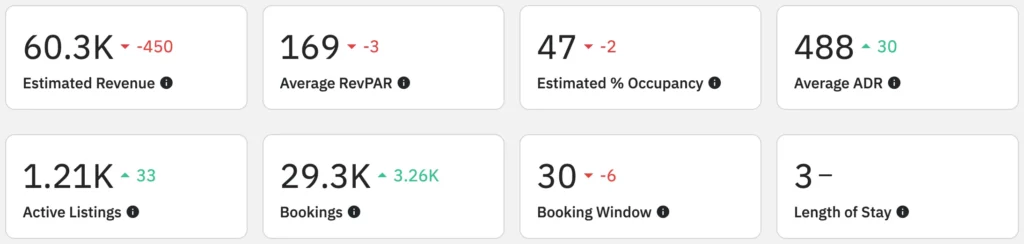
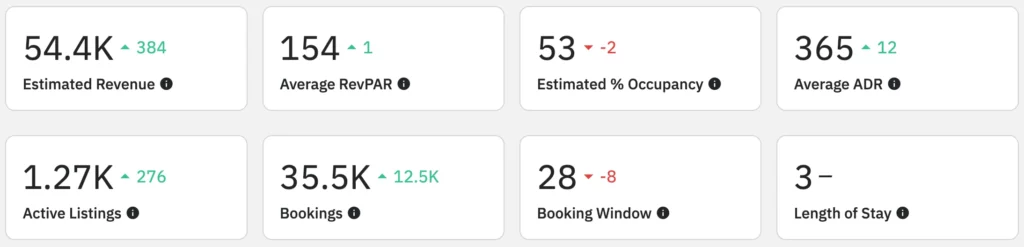
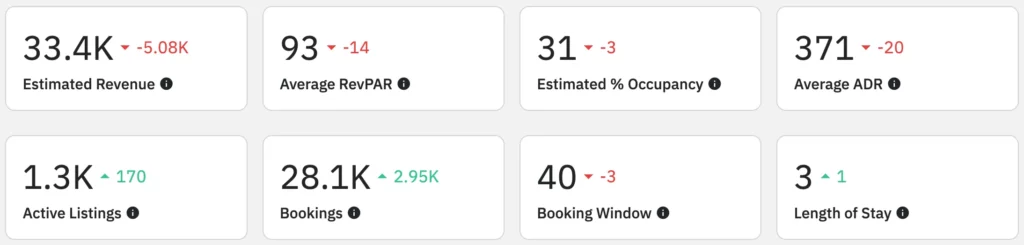
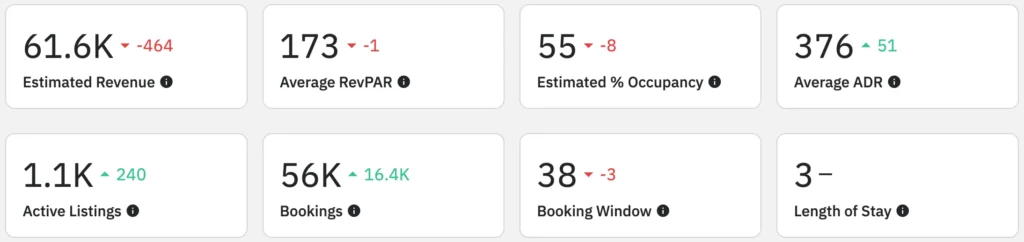
We’ve utilized a powerful tool to bring you Airbnb statistics by city: PriceLabs’ Market Dashboard. This fully automated, personalized dashboard is designed to help you monitor average airbnb prices and airbnb occupancy rates by city. Its easy-to-digest graphs and insights make it an invaluable resource for understanding market trends and making informed pricing decisions.
Average Airbnb Prices in Beach Destinations
Key West, FL
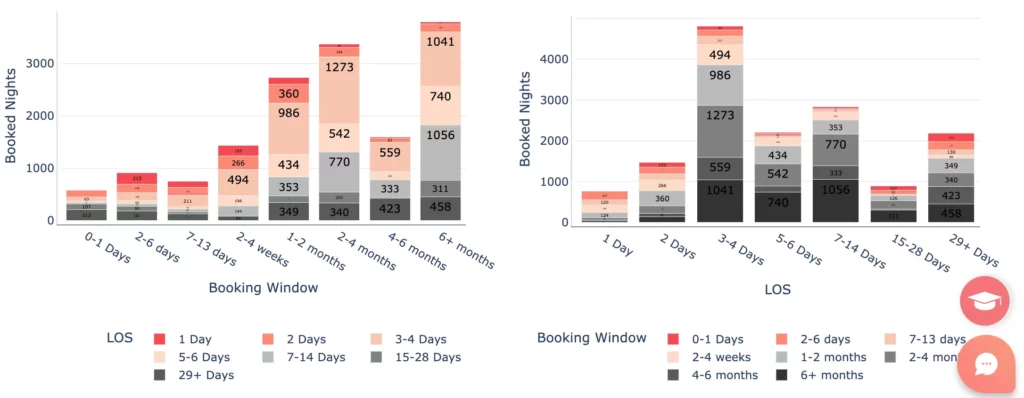
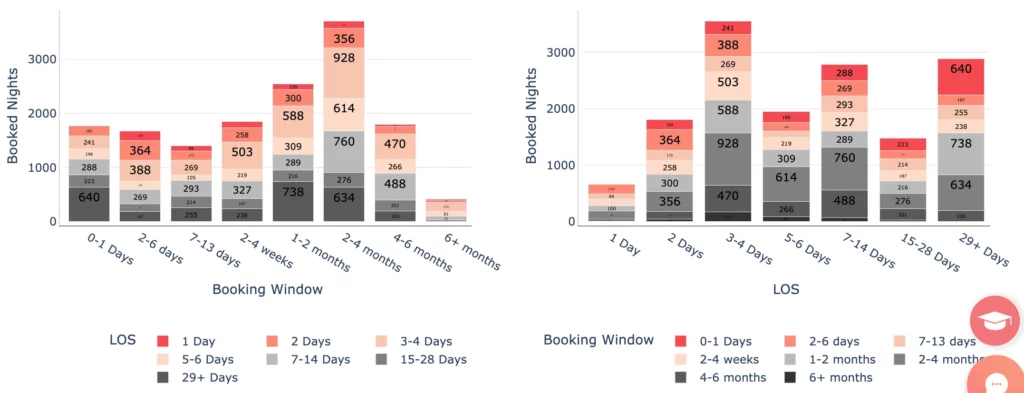
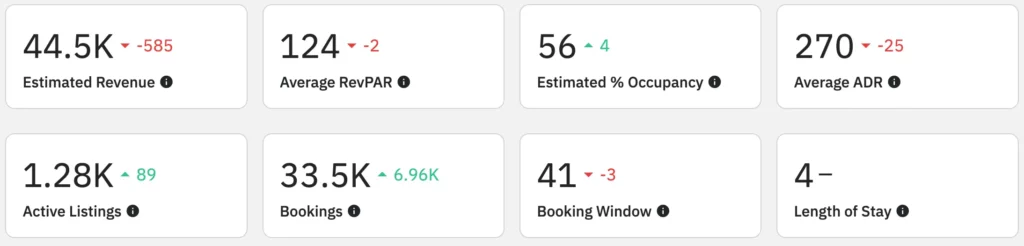
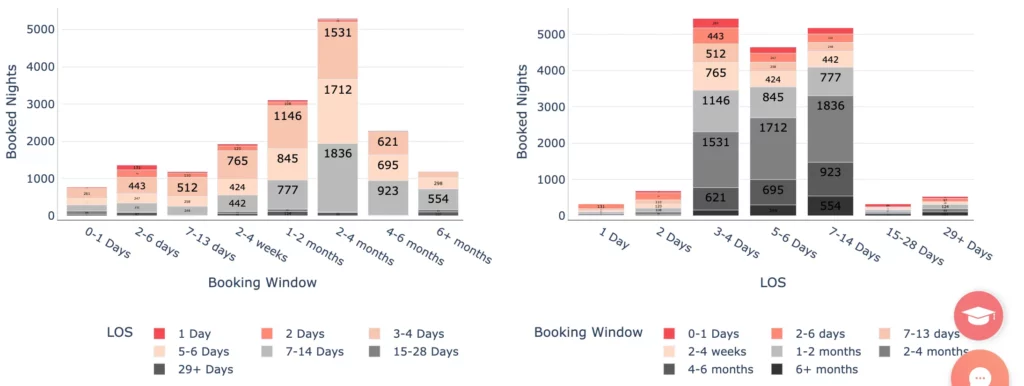
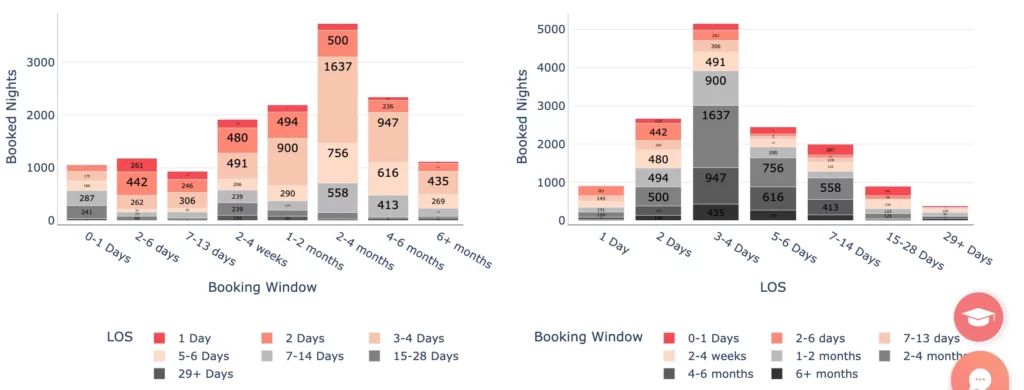
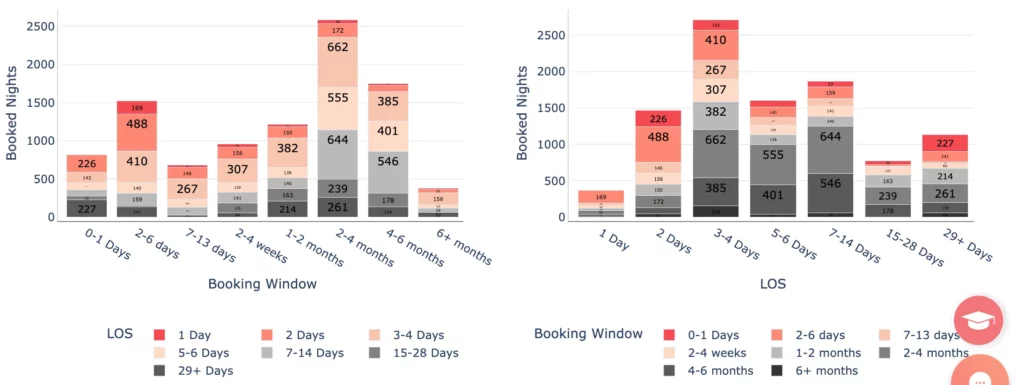
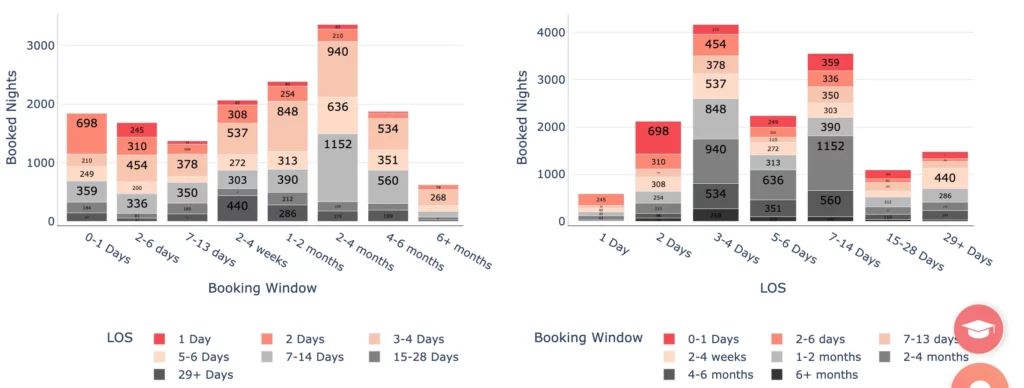
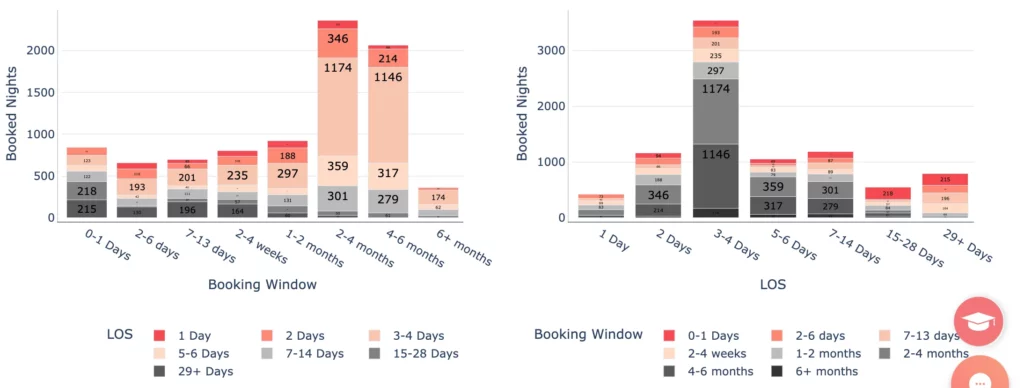
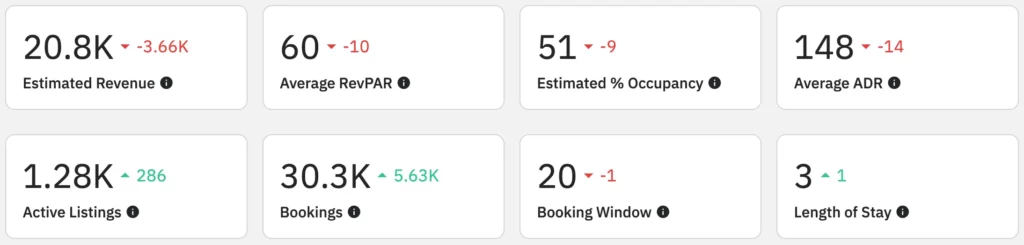
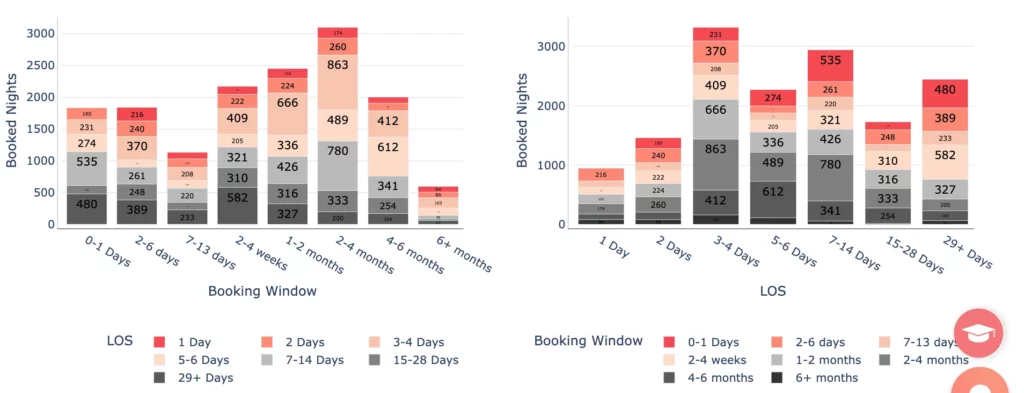
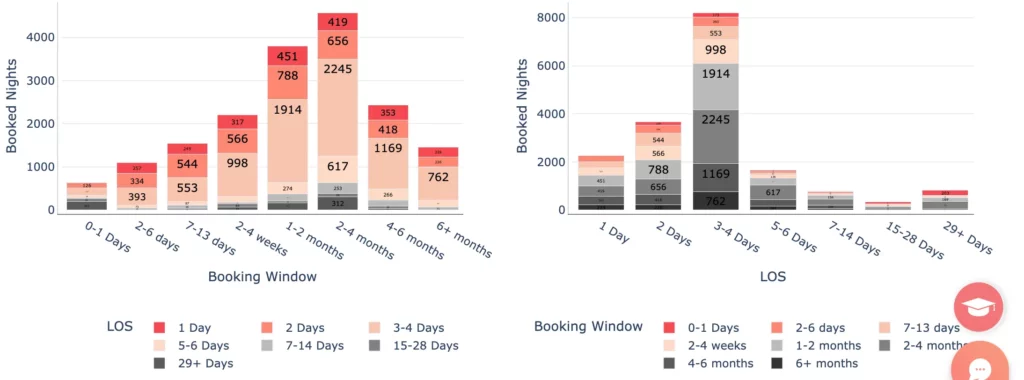
Overview of the Key West MarketLength of stay vs Booking window graphs in PriceLabs’ Market Dashboard for Key West, FL
Expensive listing
$6500
Cheapest listing
$348
Highest revenue
$14.272K
ADR
$690
Airbnb occupancy rate by city
76%
Median Length of Stay
3 days
Booking Window for Median Length of Stay
2-4 months
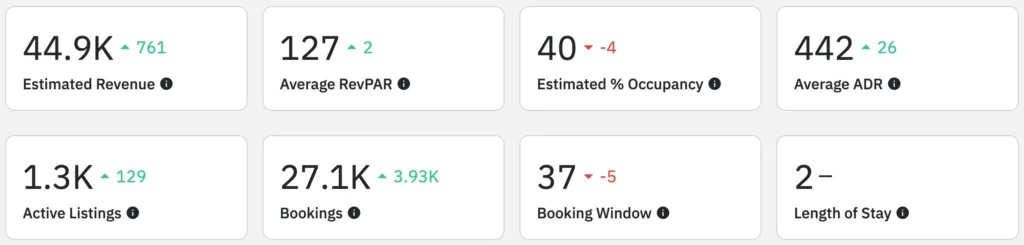
Oxnard, CA
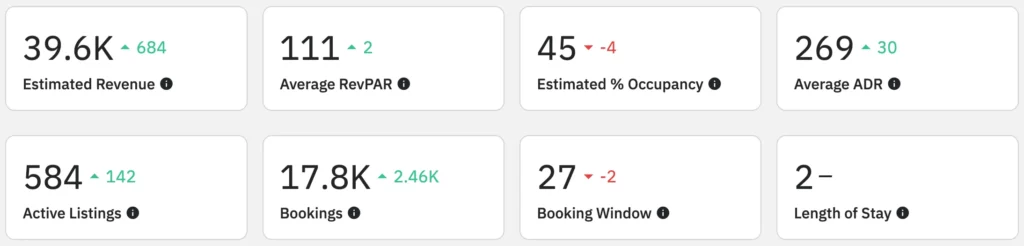
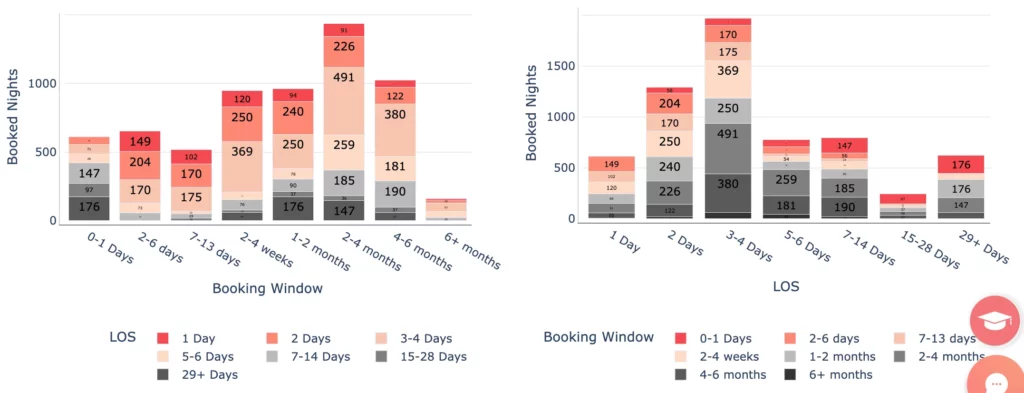
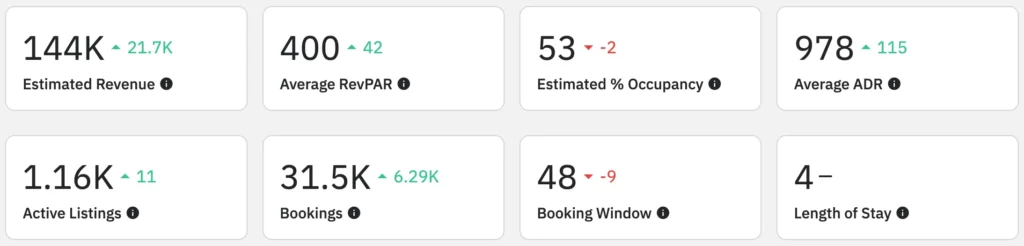
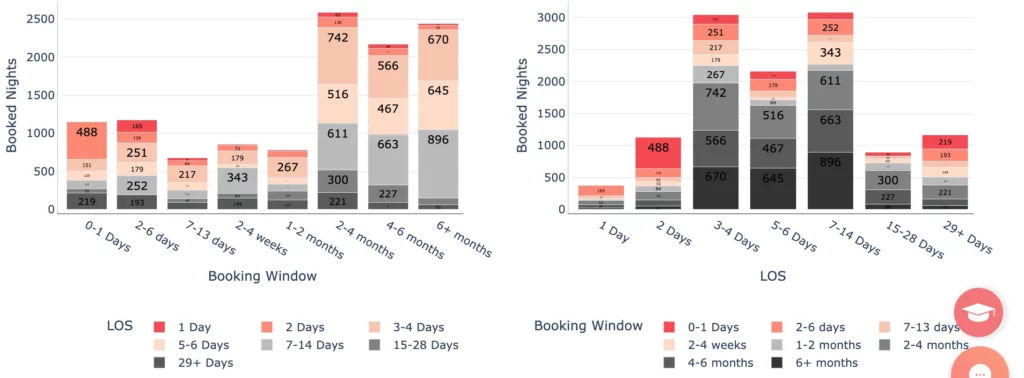
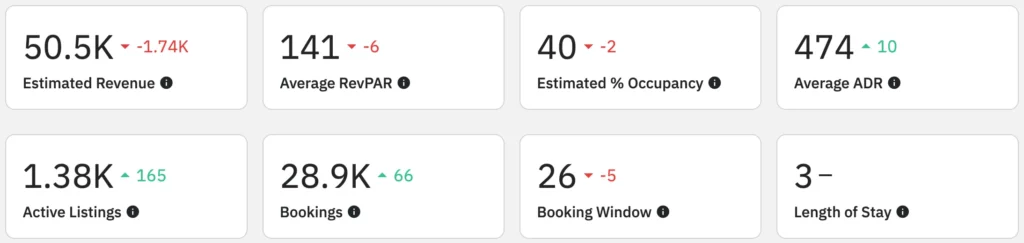
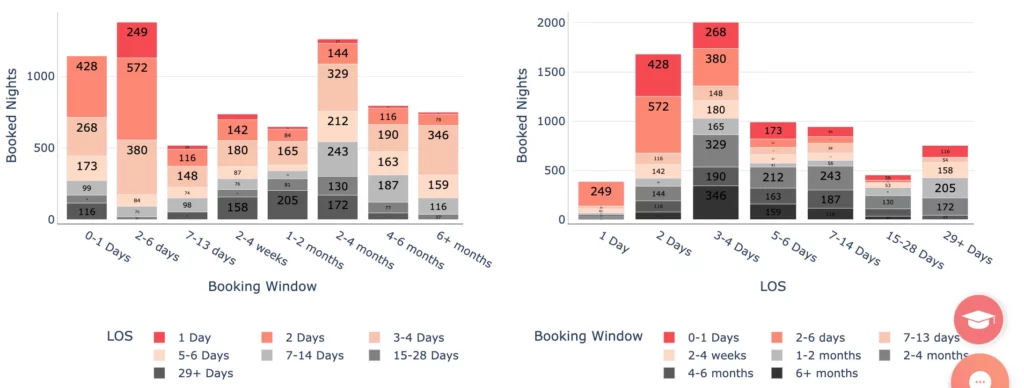
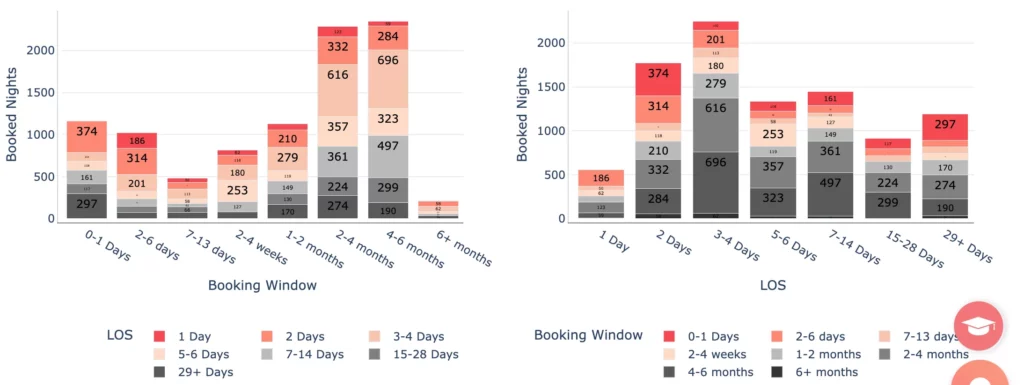
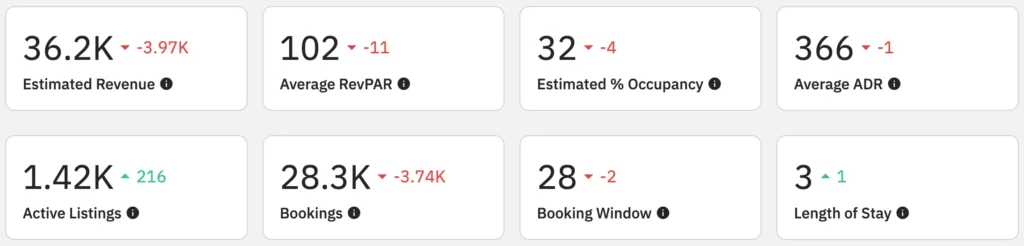
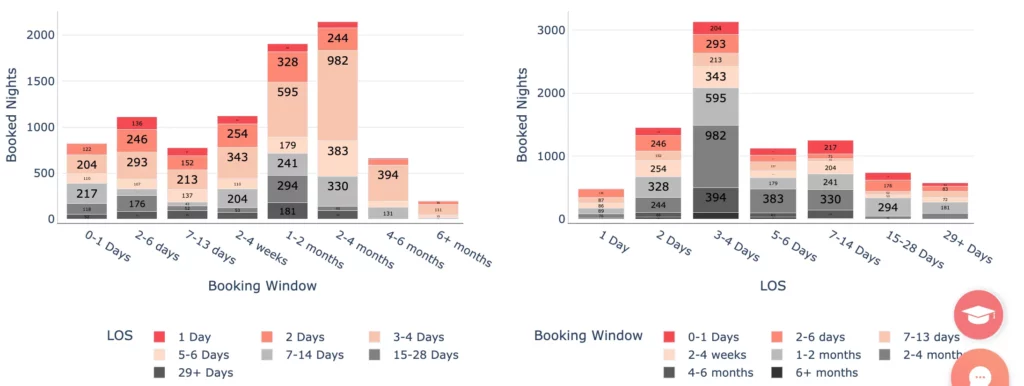
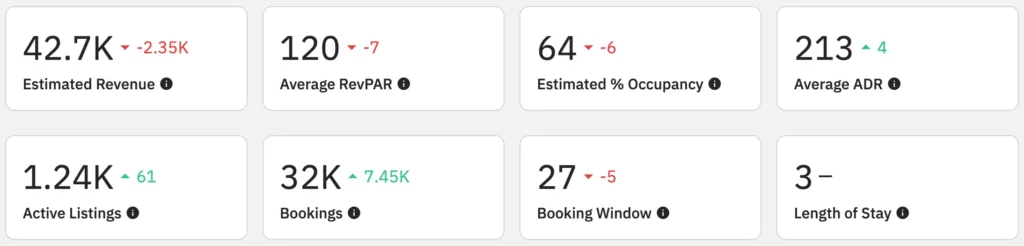
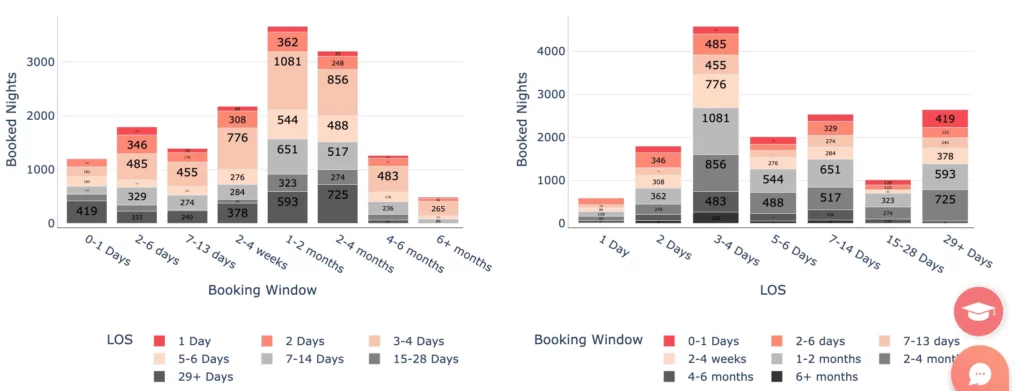
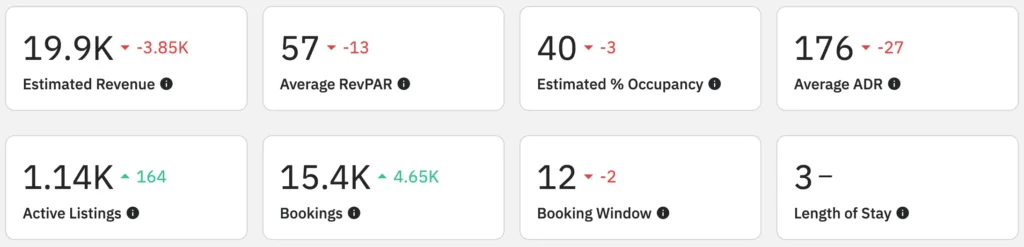
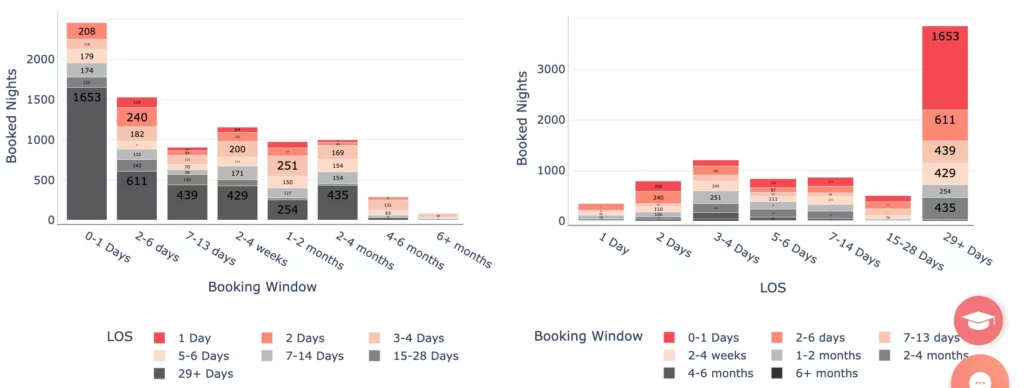
Overview of Oxnard, CA marketLength of Stay vs Booking Window graphs in Pricelabs’ Market Dashboard for the Oxnard market
Expensive listing
$3175
Cheapest listing
$25
Highest revenue
$7907
ADR
$333
Airbnb occupancy rate by city
81%
Median Length of Stay
3 days
Booking Window for Median Length of Stay
2-4 months
Long Beach, WA
Overview of Long Beach, WA marketLength of Stay vs Booking Window graph for the Long Beach market in the PriceLabs’ Market Dashboard
Expensive listing
$1323
Cheapest listing
$99
Highest revenue
$6381
ADR
$308
Airbnb occupancy rate by city
75%
Median Length of Stay
3-2 days
Booking Window for Median Length of Stay
2-4 months
Orange Beach, AL
Overview of Orange Beach, AL marketLength of stay vs booking window graph for the Orange Beach market in PriceLabs’ Market Dashboard
Expensive listing
$2799
Cheapest listing
$65
Highest revenue
$7143
ADR
$306
Airbnb occupancy rate by city
83%
Median Length of Stay
5-4 days
Booking Window for Median Length of Stay
2-4 months
Average Airbnb Prices in Ski Resorts
Mountain Village, CO
Overview of Mountain Village, CO marketLength of stay vs booking window graphs of the Mountain Village market in PriceLabs’ Market Dashboard
Expensive listing
$5000
Cheapest listing
$119
Highest revenue
$19.23K
ADR
$1185
Airbnb occupancy rate by city
74%
Median Length of Stay
3-4 days
Booking Window for Median Length of Stay
4-6 months
Estes Park, CO
Overview of Estes Park, CO marketLength of stay vs booking window graphs of the Estes Park market in the PriceLabs’ Market Dashboard
Expensive listing
$1169
Cheapest listing
$75
Highest revenue
$9.888K
ADR
$399
Airbnb occupancy rate by city
84%
Median Length of Stay
3-2 days
Booking Window for Median Length of Stay
2-4 months
Stratton, VT
Overview of the Stratton marketLength of stay vs booking window graphs for the Stratton market in the PriceLabs’ Market Dashboard
Expensive listing
$1748
Cheapest listing
$22
Highest revenue
$8057
ADR
$588
Airbnb occupancy rate by city
61%
Median Length of Stay
3 days
Booking Window for Median Length of Stay
6 months
Tahoma, CA
Overview of Tahoma marketLength of stay vs booking window graphs for the Tahoma market in the PriceLabs’ Market Dashboard
Expensive listing
$2000
Cheapest listing
$47
Highest revenue
$9.926K
ADR
$553
Airbnb occupancy rate by city
76%
Median Length of Stay
3-4 days
Booking Window for Median Length of Stay
2-4 months
Average Airbnb Prices in Lake Destinations
Saratoga Springs, NY
Overview of the Saratoga Springs marketLength of stay vs booking window graphs for the Saratoga Springs in PriceLabs’ Market Dashboard
Expensive listing
$1860
Cheapest listing
$50
Highest revenue
$10.77K
ADR
$597
Airbnb occupancy rate by city
69%
Median Length of Stay
3-2 days
Booking Window for Median Length of Stay
4-6 months
Mooresville, NC
Overview of Mooresville, NC marketLength of stay vs booking window graphs for the Mooresville market in the PriceLabs’ Market Dashboard
Expensive listing
$1790
Cheapest listing
$26
Highest revenue
$9293
ADR
$51
Airbnb occupancy rate by city
68%
Median Length of Stay
3 days
Booking Window for Median Length of Stay
2-4 months
Kingsland, TX
Overview of Kingsland, TX marketLength of stay vs booking window graphs for the Kingsland market in the PriceLabs’ Market Dashboard
Expensive listing
$1333
Cheapest listing
$40
Highest revenue
$5885
ADR
$386
Airbnb occupancy rate by city
47%
Median Length of Stay
3-2 days
Booking Window for Median Length of Stay
2-4 months
Garden City, UT
Overview of Garden City, UT marketLength of stay vs booking window graphs for the Garden City market in the PriceLabs Market Dashboard
Expensive listing
$1650
Cheapest listing
$14
Highest revenue
$9343
ADR
$460
Airbnb occupancy rate by city
66%
Median Length of Stay
3-2 days
Booking Window for Median Length of Stay
2-4 months
Average Airbnb Prices in Metropolitans
Boston, MA
Overview of Boston, MA marketLength of stay vs booking window graphs in the Boston market in PriceLabs’ Market Dashboard
Expensive listing
$715
Cheapest listing
$25
Highest revenue
$4868
ADR
$224
Airbnb occupancy rate by city
81%
Median Length of Stay
3-4 days
Booking Window for Median Length of Stay
1-2 months
Chicago, IL
Overview of Chicago, IL marketLength of stay vs booking window graphs in the Chicago market in PriceLabs’ Market Dashboard
Expensive listing
$549
Cheapest listing
$19
Highest revenue
$2483
ADR
$152
Airbnb occupancy rate by city
65%
Median Length of Stay
3 days
Booking Window for Median Length of Stay
2-4 months
Los Angeles, CA
Overview of Los Angeles, CA marketLength of stay vs booking window graphs of the Los Angeles market in PriceLabs’ Market Dashboard
Expensive listing
$1323
Cheapest listing
$99
Highest revenue
$6381
ADR
$308
Airbnb occupancy rate by city
75%
Median Length of Stay
3-4 days
Booking Window for Median Length of Stay
1-2 months
Nashville, TN
Overview of Nashville, TN marketLength of stay vs booking window graphs for the Nashville market in PriceLabs’ Market Dashboard
Expensive listing
$949
Cheapest listing
$65
Highest revenue
$6696
ADR
$421
Airbnb occupancy rate by city
66%
Median Length of Stay
3-4 days
Booking Window for Median Length of Stay
2-4 months
Travel reward, tourism, and hospitality providers will be booked and busy throughout the year. This year, there will be a strengthened focus on social media, flexible itineraries, and work-related trips. It is important to apply extra focus to your pricing strategy. With the amount of travel coming your way, you should be able to automate your pricing.
PriceLabs is a revenue management solution for the short-term rental and hospitality industry, founded in 2014 and headquartered in Chicago, IL. Our platform helps individual hosts and hospitality professionals optimize their pricing and revenue management, adapting to changing market trends and occupancy levels.
With dynamic pricing, automation rules, and customizations, we manage pricing and minimum-stay restrictions for any portfolio size, with prices automatically uploaded to preferred channels such as Airbnb, Vrbo, and 100+ property management and channel integrations.
Every day, we price over 350,000+ listings globally across 135+ countries, offering world-class tools like the Base Price Help and Minimum Stay Recommendation Engine. Choose PriceLabs to increase revenue and streamline pricing and revenue management. Sign up for a free trial at pricelabs.co today.
Conclusion
Whether you’re a guest seeking a unique experience or a host looking to maximize your property’s potential, both Airbnb and Vrbo offer distinct advantages. Airbnb shines with its diverse range of accommodations and emphasis on local experiences, while Vrbo excels in providing traditional vacation rentals ideal for longer stays and family getaways. Ultimately, the choice between the two platforms depends on your specific needs and preferences as a traveler or property owner.
Dynamic pricing in Airbnb refers to the practice of adjusting rental rates in real time based on various factors such as demand, seasonality, local events, and market conditions. This approach allows hosts to optimize their earnings by automatically increasing or decreasing prices to match supply and demand fluctuations. By utilizing data and algorithms, dynamic pricing aims to find the optimal balance between attracting guests and maximizing revenue, ensuring that prices reflect the current market dynamics.
To implement dynamic pricing for vacation rentals, collect relevant data, identify key factors, set pricing rules, use dynamic pricing software, monitor performance, and adjust as needed to optimize revenue.
The aim of dynamic pricing is to optimize revenue and occupancy rates. It is done by adjusting prices in real time based on factors such as demand, market conditions, competition, and other variables. Dynamic pricing softwares seeks to find the optimal balance between attracting guests and maximizing profitability by dynamically setting prices that reflect current market dynamics. The goal is to capture the highest possible value for each booking while ensuring competitiveness in the market.
0%
Get started with PriceLabs
Want to learn what PriceLabs can do for you? See for yourself with a free trial