Updated: February 27, 2024
Key Takeaways
The dataset provides information about the hospitality industry in the Canary Islands, Spain, from January 2021 through January 2024, focusing on short-term rental market performance.
- Average Daily Rate (ADR) increased significantly from 80€ in January 2021 to 110€ in January 2024.
- Revenue Per Available Room (RevPAR) also showed a substantial progression from 30€ in January 2021 to 92€ in January 2024.
- The occupancy rate peaked at 83% in January 2024, noticeably higher than 37% in January 2021.
- The average monthly bookings varied without a clear trend, with a peak of 4.1 in January 2024.
- However, the count of active listings consistently increased, from 32,084 in January 2021 to 46,591 in January 2024. The steady increase in active listings also suggests the region’s attractiveness to hosts and property owners.
- Overall, the Canary Islands’ accommodation industry has shown significant growth and strength over the observed period.
ADR Summary
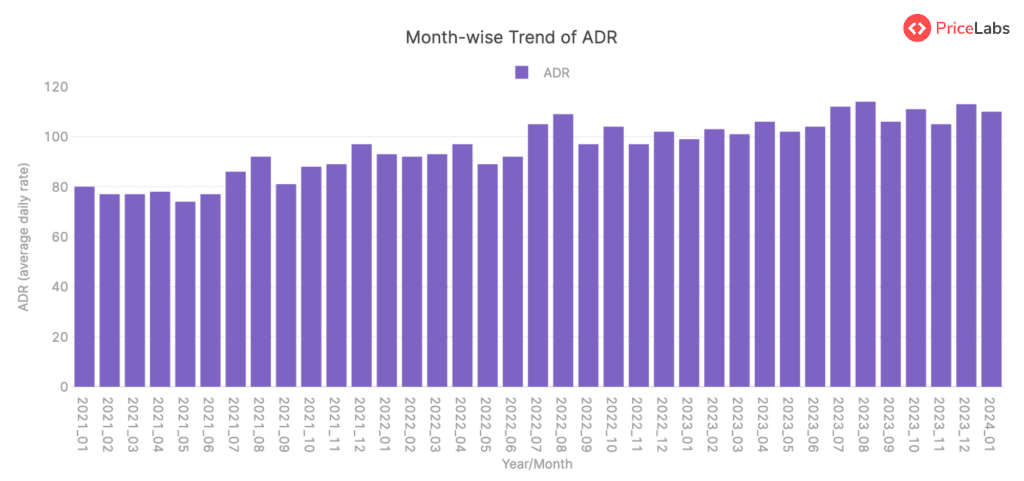
The data for the region of the Canary Islands, Spain, from January 2021 to January 2024 shows a progression in the Average Daily Rate (ADR), which is represented in Euro (€). Starting from an ADR of 80€ in January 2021, it slightly decreased to 74€ in May 2021 before gradually increasing to 92€ in August 2021. A fall was again observed from August to 77€ in June 2021.
However, a significant upward trend was noticed from June 2021 starting at 77€ leading up to a peak of 97€ by December 2021. In the first quarter of 2022, the ADR marginally dropped and floated between 92€ to 93€, before rising to 97€ in April 2022. Post-April, there was a fluctuation, with the ADR dropping to 89€ in May and then rising again to 109€ by August 2022.
The year 2023 observed a similar pattern, starting at 99€ in January and eventually increasing to reach 114€ by August. The ADR again saw a gradual decrease, reaching 102€ by May 2023, before it rose again to 112€ in July 2023.
During the final available months from 2023 to January 2024, the ADR values showed a consistent increase, peaking at 113€ in December 2023 and then slightly decreasing to 110€ in January 2024. The observed ADR trend throughout these years mostly demonstrates a seasonal pattern with spikes often seen around August yearly.
RevPAR Summary
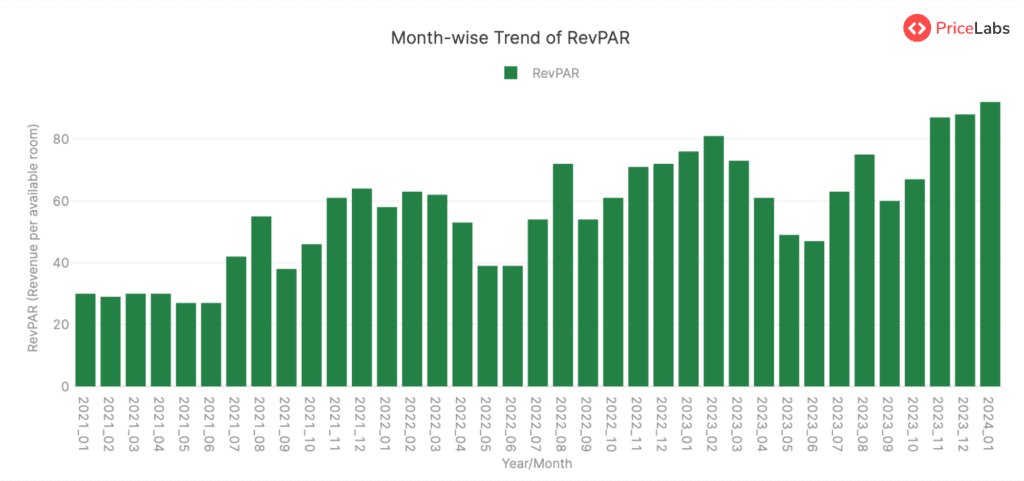
The RevPAR (Revenue Per Available Room) in EUR for the Canary Islands, Spain, has experienced a general increasing trend from January 2021 to January 2024. Starting at 30€ in January 2021, it dipped slightly to 27€ in May and June 2021. A significant growth was observed from July to December 2021, with the RevPAR peaking at 64€ in December 2021. From January 2022 to December 2023, RevPAR alternated between periods of growth and slight decreases, with a peak of 81€ in February 2023. However, from May to June 2023, a notable decline to 47€ was reported. Recovery was observed from July 2023 onwards, with RevPAR reaching 92€ in January 2024.
Based on the provided data, there seems to be a seasonal trend with higher RevPAR typically observed during the winter months (November to February), and lower RevPAR in the spring and early summer (May to June). Examining the RevPAR trend tells us about the consistent growth and seasonal patterns in the short-term rental market performance.
Read here: How to Calculate RevPAR.
Occupancy Rate Summary
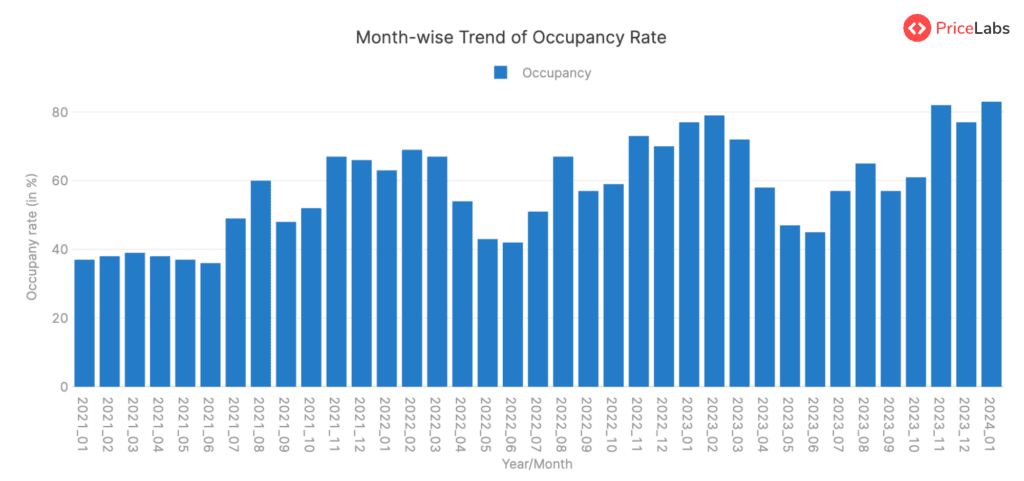
In the Canary Islands in Spain, the occupancy trend appears to follow a seasonal pattern over the years, with noticeable dips and rises. Starting from January 2021 with a 37% occupancy rate, there was an increase and decrease pattern observed up until June 2021, with rates moving between 36% to 39%. However, a significant jump was noticed in July 2021, when the rate increased to 49%. This trend continued, peaking in November 2021 at 67%.
Throughout 2022, the occupancy rates fluctuated, starting from 63% in January 2022 to a peak of 69% in February 2022. It then decreased to its lowest point of 42% in June 2022. The rate again peaked at 73% in November 2022 and slightly decreased to 70% in December 2022.
In 2023, the maximum occupancy rate was reached in February, hitting 79%, but dipped to 45% by June. Toward the end of 2023, there was another peak as the occupancy reached 82% in November.
The occupancy steadily increased at the beginning of 2024, reaching as high as 83% in January. It is important to note that the occupancy rate typically increases around the beginning and end of each year, suggesting potential seasonal effects reflected in booking patterns.
Read here: How to Calculate Occupancy Rate.
Avg. Bookings Summary
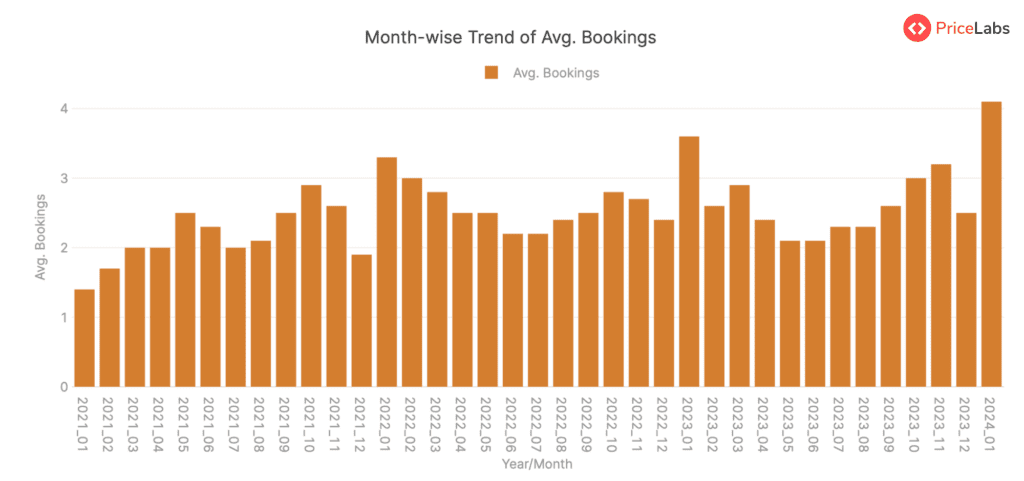
The average bookings for the Canary Islands region in Spain have shown an overall increase between January 2021 and January 2024. The average bookings started at 1.4 in January 2021 and reached the highest average of 4.1 by January 2024.
While going through the data, it appears that there is a seasonal trend with higher average bookings observed in the first month of the year and the last quarter (October – December) annually. Specifically, since 2021, January consistently witnessed increased bookings, with the notable highest being in January 2024. The last quarter months also had relatively higher bookings, with November often witnessing a significant increase.
However, the bookings tend to dip in the mid-year months (May – September). Across the years, there’s an overall gradual increase, with occasional fluctuating months. This suggests the region’s consistent growth in rental market performance.
Count of Active Listings Summary
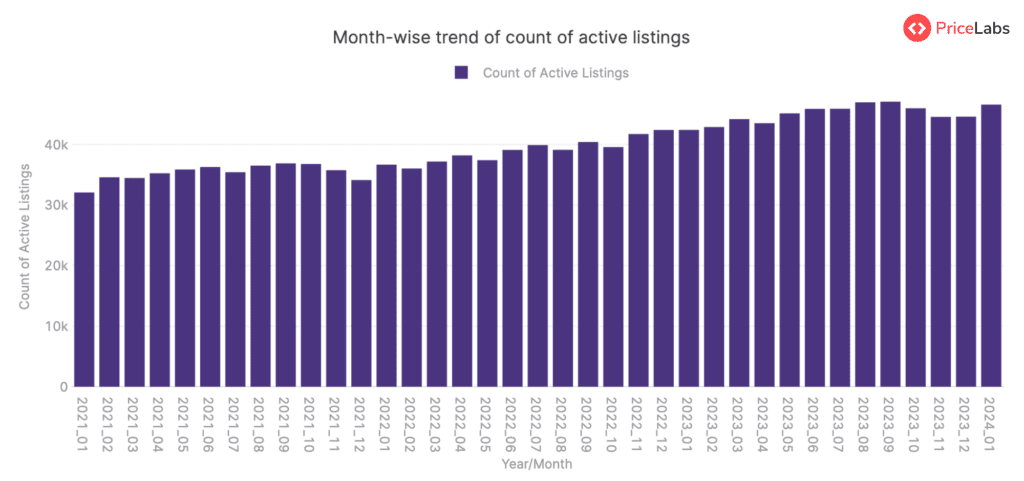
Based on the data provided, the count of active listings in the Canary Islands region of Spain has generally shown an increasing trend from January 2021 to January 2024.
In January 2021, the number of active listings was 32,084. This number gradually increased over the months, showing some fluctuations but maintaining an overall upward trajectory.
For example, by February 2022, the count was 36,040, and it further rose to 44,193 by March 2023.
By the end of the given data set, in January 2024, the active listings had increased significantly to 46,591.
This trend suggests a growth in active listings in this region over the given period. The growing number of active listings reflects the region’s popularity among hosts and property owners, indicating a thriving rental market performance. Please note that this is an analysis of historical data and does not make future predictions.
Get actionable market insights from PriceLabs’ Market Dashboards.
About Short-term Rental Index
The World STR (Short-term Rental) Index by PriceLabs is a free tool for tracking short-term rental market performance worldwide. It offers data from Airbnb markets worldwide, refreshed monthly. You can access free insights on which locations are gaining or losing popularity. Key features include:
- Compare: Compare year-over-year metrics like active listings, occupancy rates, RevPAR, and ADR.
- Trend: Visualize how metrics have changed over the past years.
- Pacing: Compare upcoming year metrics to the previous year for occupancy, ADR, and RevPAR.
Explore more FREE tools by PriceLabs here.
About PriceLabs
PriceLabs is a revenue management solution for the short-term rental and hospitality industry, founded in 2014 and headquartered in Chicago, IL. Our platform helps individual hosts and hospitality professionals optimize their pricing and revenue management, adapting to changing market trends and occupancy levels.
With dynamic pricing, automation rules, and customizations, we manage pricing and minimum-stay restrictions for any portfolio size, with prices automatically uploaded to preferred channels such as Airbnb, Vrbo, and 100+ property management and channel integrations.
Every day, we price over 300,000+ listings globally across 135+ countries, offering world-class tools like the Base Price Help and Minimum Stay Recommendation Engine. Choose PriceLabs to increase revenue and streamline pricing and revenue management. Sign up for a free trial at pricelabs.co today.