Summary:
- PriceLabs Market Dashboards are personalized dashboards that track vacation rental data worldwide retrived from Airbnb, Vrbo and KeyData and provide actionable insights and graphs.
- They are used by property managers, vacation rental owners, and potential investors to analyze vacation rental markets, track listing performance, and create pricing strategies to optimize revenue.
- Market Dashboards help in making revenue management decisions for the portfolio, understanding market trends, comparing listing performance with competitors, and identifying investment opportunities.
- Users can create a customized Market Dashboard by entering the location and search radius, listing type, etc. The generated dashboard provides tables and charts with details about rates, occupancy, and booking trends for listings in the selected area. It can also be used to make investment decisions.
Property managers and vacation rental owners from around the globe are analyzing their vacation rental markets with PriceLabs Market Dashboard. They track their listing’s performance against competitors by looking at charts and graphs. The insights help them create a pricing strategy to optimize their revenue.
Potential investors also use market Dashboards to identify markets, bedroom count, and amenities that generate the most revenue in a given market.
What are Market Dashboards?
PriceLabs Market Dashboards are fully automated personalized dashboards that track vacation rental data worldwide and display it as actionable insights and graphs. Our data is collected from Airbnb and Vrbo, which you can view in Market Dashboards.
You can order a Market Dashboard with all the historical data regarding your listing. The scrape data comes directly from Airbnb and Vrbo and is updated daily. You can check the daily reports to get insights into the market trends in your vicinity.
Where does the data come from?
VRBO and Airbnb send PriceLabs raw data. Our team of experienced data scientists then converts this data into actionable insights. They have a thorough understanding of the vacation rental market.
- VRBO + Airbnb
- Updated daily
- NOT direct booking data, but we capture direct bookings by tracking OTA availability
What is Market Dashboards used for?
Making revenue management decisions for the portfolio
Market Dashboards help determine what customizations and pricing strategies would best suit you. This means you can decide what minimum stay restrictions to use. You can also see which dates are receiving more bookings and set your prices and minimum stay date accordingly.
It will help you to understand how to price your Airbnb listing.
Analyzing the market for investment potential
A lost of investors use PriceLabs Market Dashboards to make investment decisions. Since you don’t need listings to access Market Dashboards, you can use them to analyze the booking trends and performances of other vacation rentals in a particular area and understand if they make good investment options.
Compare your listing with other listings within your area.
Many owners use Market Dashboard to compare their listings’ performances with others to identify their strengths and weaknesses and strategies they can work on. This is a great tool to identify your booking trends with others and determine if you want to switch to a different property manager who is better at managing listings in your area.
You can also create a comp-set in Market Dashboards that doesn’t include your own host ID, excluding your listing when making comparisons. Also, you can compare the performance of a specific property manager in addition to excluding your own listings.
Honing in on specific listings is essential to the success of the Market Dashboard for any of the above-mentioned use cases.
How to create a Market Dashboard for your Vacation Rental?
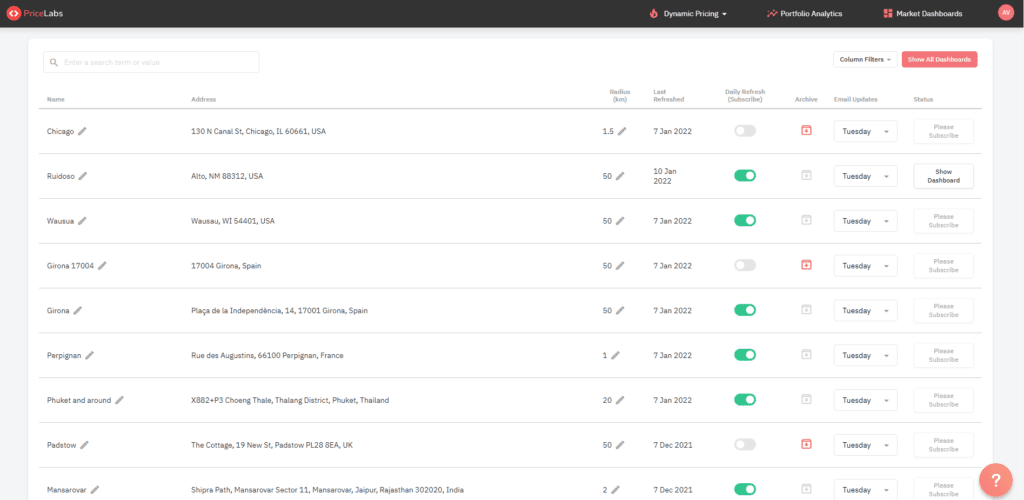
If you already have an account on PriceLabs with your listings loaded in, click the Market Dashboard button in the top right corner.
On the Top Left Corner, you will see ‘Credits Left’.
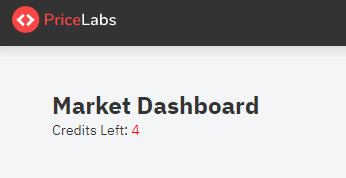
For a new account using the free subscription, you will be provided with 1 credit.
PriceLabs provides all its users with a free Market Dashboards subscription for one month. After one month, you can either continue by getting a paid subscription or turn off the Daily Refresh button to stop getting updates. You won’t be charged for the service in that scenario.
These Dashboards are primarily based on the address of the listings. It can be anywhere in the world; if there are Airbnb or Vrbo listings in that area, PriceLabs can pull the data and present it to you.
To begin with, click on ‘Create Dashboard’ to make your first dashboard. Enter a location (this can’t be changed later) and search radius for your report. Your radius can be between 0.1 Km and 50 Km, and you can change it later. This radius tells us how far out listings you want to analyze.
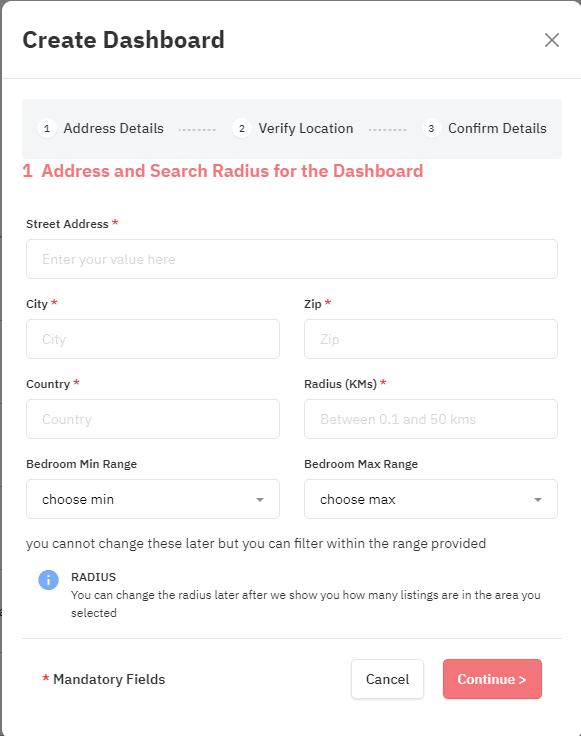
Click ‘Continue’ to check a map’s location and search radius, and click ‘Continue’ again.
Next, fill in the Dashboard’s name and currency (default currency is USD), select the Market Dashboard plan according to your requirement, and click ‘Generate Dashboard’.
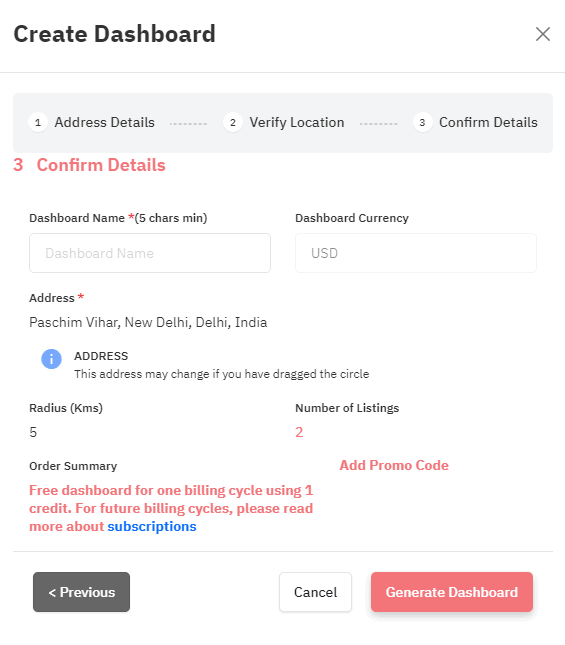
It will take 5-10 mins to generate your Dashboard. Once a dashboard has been developed according to your location and search radius preferences, you’ll see several tables and charts giving details about rates, occupancy, and booking trends for listings in your selected area.
You can also use PriceLabs Portfolio analytics to understand your listing performance and improve your pricing strategy for free.
Listing Map and Comp-Set
Once you have created a dashboard, you’ll see all the listings in that area. You can look at specific listings based on the number of bedrooms by selecting those in filters at the top left corner.
The map will show the approximate location of the active listings in the report area. You can hover over each dot on the map view to see how many bedrooms that listing has and the average rate over the next year. The color of each dot is determined by the number of bedrooms the listing advertises, while the size of the dot corresponds to the listing’s average rate. The tool in the top right of the map will let you pan, zoom, and select areas on the map. Double-click on the map to unselect any selections you’ve made
You can also customize groups to manage multiple listings together.
How to Create a Comp Set for your vacation rental?
You can create a comp set to look at data from specific listings. To do this, you can draw a lasso on the map to select the area from which you want to retrieve the data. When you click on create comp set box, you will only see vacation rentals from that area.
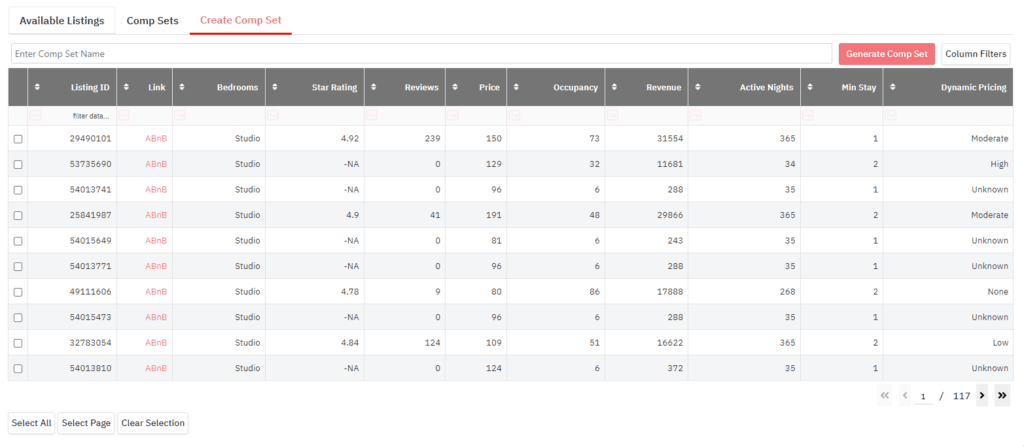
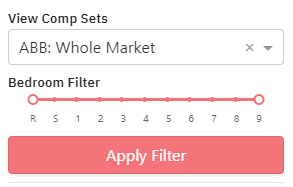
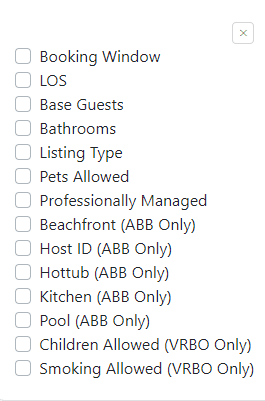
You can use the bedroom filter on the left to select a specific number of bedrooms per unit and see properties with that bedroom count. Then use the check box to add the bathroom filter to the listing grid. Filter by bathroom count and select the listings you want to include in your comp-set. You can also choose properties based on their reviews, individual property or property managers, amenities, etc. Just click on column filters to select your preferences.
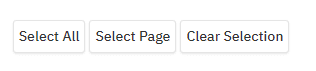
Now, you can select all the properties that appear after applying the filters by clicking on ‘Select All’ or manually selecting the properties you want to analyze. You can also sort these properties by clicking on any criteria.
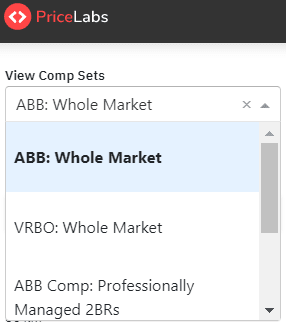
Once you’ve selected your vacation rental listings, give the comp-set a name and click ‘Generate Comp Set’. You’ll be prompted to verify the name and number of listings included. Click to confirm your selection, and your comp-set will appear on the list of available comp-sets in the drop-down on the top left of the Dashboard. You can use your comp sets or any of our pre-loaded comp sets to filter the data shown in the rest of the Dashboard.
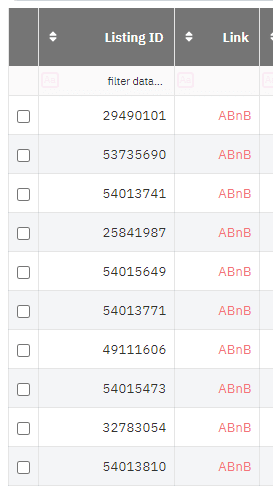
You can view each listing on Airbnb using the link provided against each listing.
Making Revenue Management Decisions about your vacation rental
Finding the correct price level
To view the prices set by other listings, you have selected in your comp-set, you can set a filter for ‘Median booked Prices’ under the Future Price section. The colors will show you what prices people are booking. The grey line touches the pink line, the median listed price.
You will notice that the median booked price is below the median listing price in the low season. However, it is above the median listed prices in the high season and below in the future.
Optimizing prices for high-demand dates
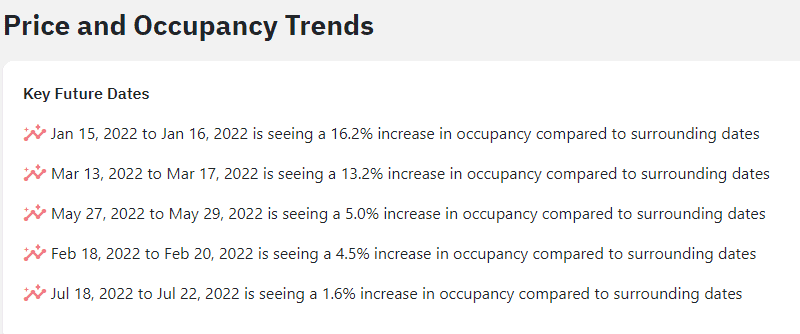
Key future dates
Key Future Dates appear under the Price and Occupancy Trends section. This chart spotlights a few dates with a higher occupancy percentage than those surrounding them. You can use the listed dates to spot emerging high-demand periods and adjust pricing and stay requirements accordingly. You can check out how each of these dates appears on the Future Occupancy Chart below to compare how bookings are being made on surrounding dates.
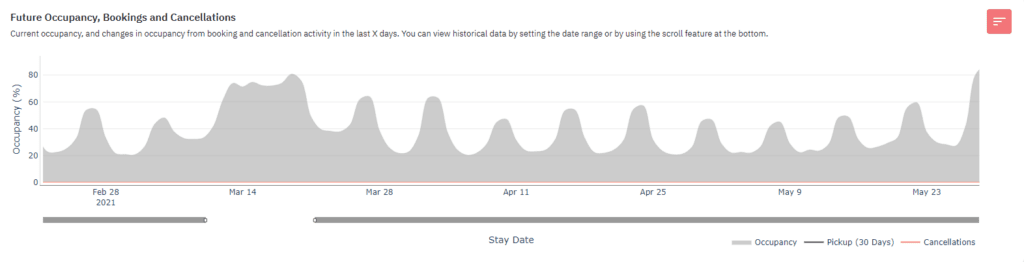
Future occupancy, bookings, cancellations (historic view)
The Future Occupancy, Bookings, and Cancellations graph have three lines:
- Occupancy (grey)
- Pickup (black)
- New Cancellations (red) made in the selected time frame
The occupancy graph can give you an idea of which dates are still busy and which low-demand dates to consider how you should price your property. By default, the chart will show the following year’s data, but you can use the sliders below the chart or the date range selectors to narrow in on a shorter date range or select the number of past days for which you’d like to see booking activity.
Selecting the date range or scrolling the bar at the bottom gives you a historic view of the data. You can see which dates witnessed a higher booking trend in the previous year and make booking trends forecast accordingly.
Cross-referenced with future prices (historic view)
The Future Prices graph details how property managers price their properties for future dates. You can start thinking about your properties’ revenue management strategy between this and the graph above.
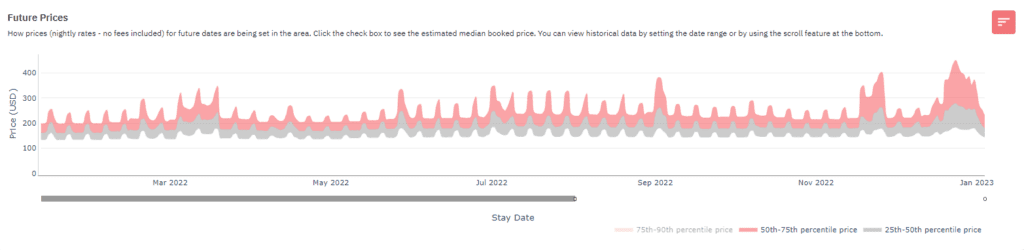
The Median Booked Price line estimates the prices at which listings are getting booked. This line is not shown by default since it’s an estimate, but you can add the line to view the forecasts along with the percentile graphs by ticking the Median Booked Price box above the chart.
Optimizing the occupancy of vacation rentals with minimum stay:
Length of Stay by Stay Date
The Length of Stay by Stay Date graph shows the typical duration of bookings made for any given date in the past number of days selected. You can hover your mouse over the graph to see details on stay length and average nightly rate for a specific date. This helps you identify how long guests typically book for during significant events, holidays, etc., allowing you to set booking overrides accordingly.
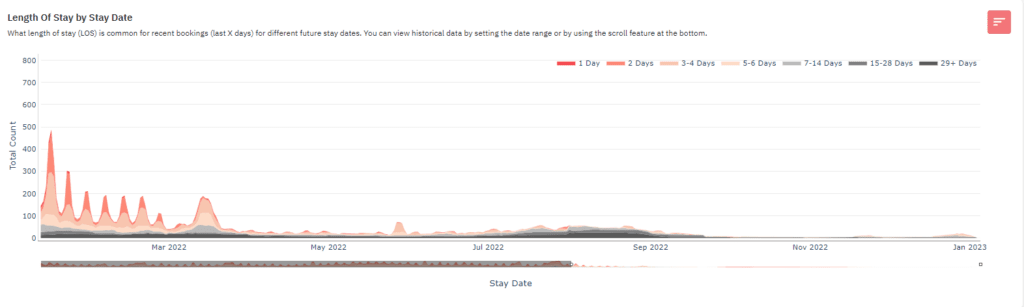
You can use LOS by Stay date to identify the minimum length of stay during any event or holiday. Once you know the median length of stay for a particular date, you can change your minimum night requirement to get the maximum bookings.
Minimum Stay Strategy
You can set your minimum stay strategy by looking at your selected dates’ length of stay by stay date graph. For the dates receiving more days, your property will likely be booked for more nights if you increase your minimum stay for those dates.
LOS vs. Booking Window
LOS vs. Booking Window charts compares the booking window to the length of stay for booked nights. The number of busy nights for each lead time range is presented in the left chart, and the number of occupied nights booked in each stay length category is presented in the right chart.
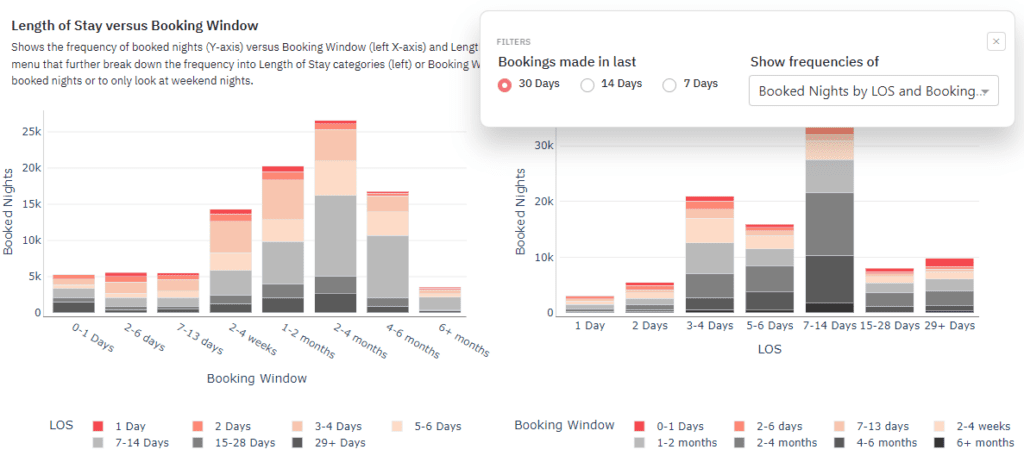
You can see options for viewing occupied nights and bookings data if you click the drop-down. The options there are:
- Occupied Nights
- Occupied Nights by LOS and Booking Window
- Number of Bookings
- Number of Bookings by LOS and Booking Window
- Occupied Nights Weekend Only
- Occupied Nights Weekend Only by LOS and Booking Window
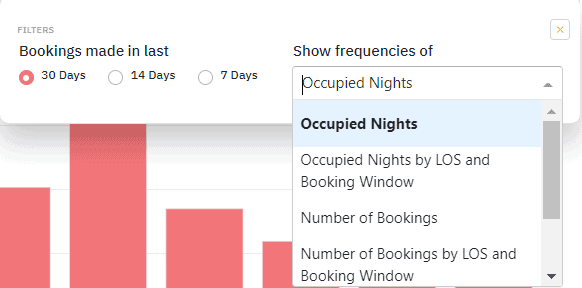
If we switch our view to break down the occupied nights by LOS and booking window, we can see on the left that last-minute stays booked in the past 30 days range in length from 2 to 14 days, and on the right, lead times for the popular 3-4 day stays in this area are usually 2 days or more.
The Amenities Section
This section has two charts detailing desired features in a listing. The chart shows the percentage of vacation rentals with an amenity and the percentage of bookings received by the listing with that amenity. The ‘Common Amenities’ chart presents the amenities by the percentage of listings with them. In contrast, the Desired Amenities chart arranges the amenities by those with the most significant difference between the percentage of listings with that amenity and bookings.
This can help you determine whether providing an extra service would be worth the investment. If a certain amenity is in demand in your market, you can include that in your listing and price your vacation rental competitively.
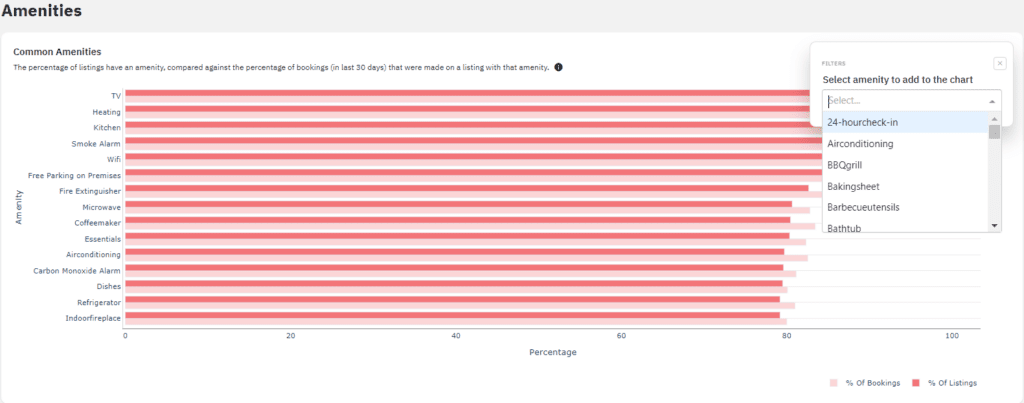
If there is a specific amenity you are trying to find details on, you can use the search bar to see how many listings in your area have that amenity. Note that this searches only for your market’s 50 most common amenities. If an amenity, shampoo, for example, is in high demand right now, make sure to add it to your listing page if you have it as it seems to be desired.
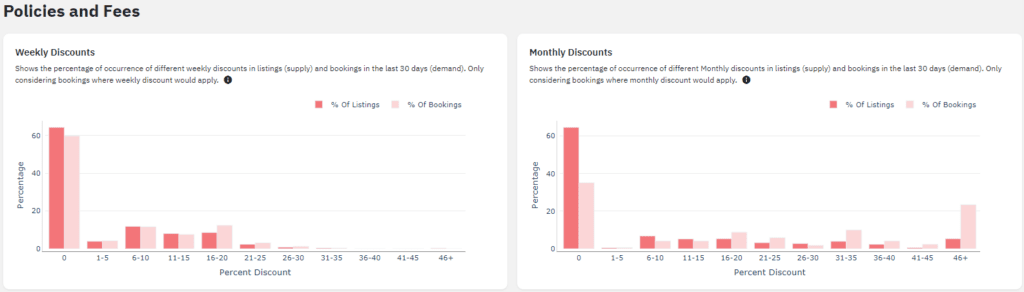
Are your policies and fees set optimally for attracting guests to your vacation rental?
Similar to the amenities charts, the Weekly Discounts and Monthly Discounts charts show the percentage of bookings made in the past 30 days compared to the percentage of listings with a fee in that range.
Weekly and monthly discounts
The Weekly and Monthly discounts chart shows which weekly or monthly discounts are more popular. The red-colored bar on the chart shows the percentage of discount listings. The pink-colored bar exhibits the percentage of bookings received for a specific discount range.
Cleaning fee & Cancellation Policies
The chart shows the percentage of listings and bookings made for different Cleaning Fees and Cancellation Policies.
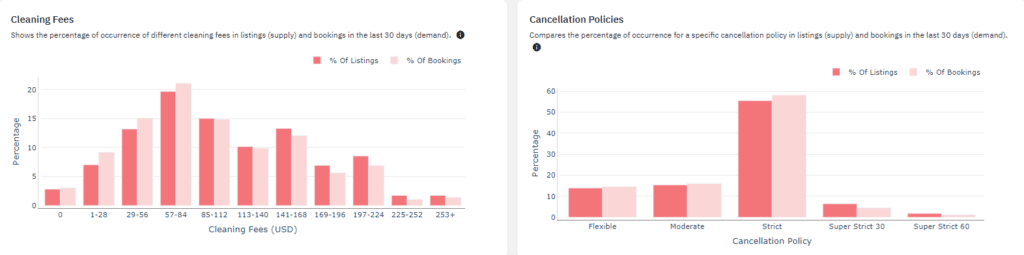
Pre-filtering the comp sets ensures your cleaning fee is not compared to a listing with a larger or smaller bedroom count. To determine your cleaning fees, you should review the percentage of listings vs. the percentage of bookings graph. This helps you avoid setting a very high or low cleaning fee. Otherwise, it would either discourage bookings or result in a lack of profits for the owner.
Analyzing Vacation Rental Markets for Investment Potential
If you want to invest in a vacation rental property, the market dashboard can help you determine if the market is worth investing in. You must first create a comp set with all the amenities and bedroom count you intend to invest in.
- In this regard, the most helpful thing would be to quickly go through the Market history by bedroom category graph to compare revenue and occupancy by bedroom count. This will help you determine what properties can generate income according to their bedroom count.
- Also, use this to figure out which types of listings match the operational capacity you will potentially have. You can see which properties cater to short stays and which ones cater to midterm or more extended stays. Then you can identify what would be more beneficial for your property to optimize your potential revenue.
- You can also look through the ‘Desired Amenities’ graph or create multiple compsets for pool, hot tub, beachfront, pet friendly, etc. and compare revenue for similar listings with different amenities. This will help you determine which amenities get more bookings than others.
PriceLabs Market Dashboard is popular among vacation rental owners and property managers. If you want to optimize your vacation rental revenue, go to PriceLabs Market Dashboard and create your account. You can try out the tool for free for a month and then decide if you’d like to continue with the subscription or not.
About PriceLabs
Established in 2014 and headquartered in Chicago, PriceLabs is a leading provider of innovative and easy-to-use dynamic pricing and revenue management solutions for the rental industry. PriceLabs provides a data-driven approach, automation rules, and customizations to manage pricing and stay restrictions that help property owners and managers increase revenues efficiently and easily. With over 90 integrations and a growing list of channels and property management systems, PriceLabs’ automated revenue management solution is built to serve the needs of everyone, from large property managers to single-property owners. Learn more at www.pricelabs.co.