
Updated: October 14, 2024
Key Takeaways
- The given data represents Germany’s entire short term vacation rental landscape from August 2023 to August 2024.
- The highest Average Daily Rate (ADR) recorded was 105€ in October 2023, whereas, it stooped lowest to 96€ in February and March 2024.
- Revenue per Available Room (RevPAR) reached its peak at 61€ in July 2024 and sank to the lowest at 36€ in January 2024.
- The occupancy rate was at its maximum of 61% in August 2023 and July 2024, and at the lowest of 40% in January 2024. Average bookings showed marginal fluctuations ranging between 2.3 to 3.2 during the period.
- The count of active listings followed an increasing trend with a minor dip in November 2023 and reaching its highest at 237,452 in August 2024. However, no bookings are seen in August 2024, which could be a topic of further analysis.
- Overall, variation in hospitality & short term vacation rental trends throughout different months of the year are evident.
ADR Summary
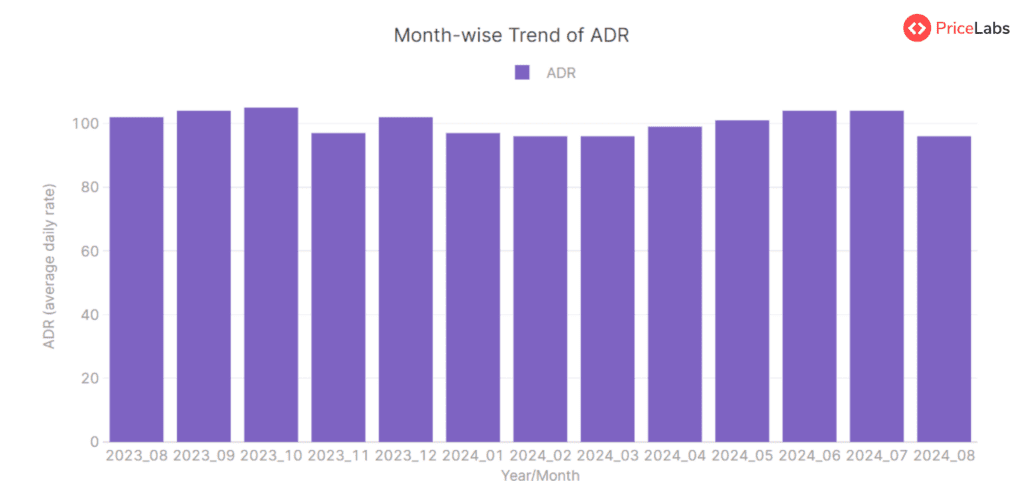
The Average Daily Rate (ADR) for Germany, represented in euros, demonstrated some fluctuations between August 2023 and August 2024. In August 2023, the ADR was 102€, which slightly increased to 105€ by October. However, November saw a drop to 97€. The ADR then rebounded to 102€ in December and dropped again to 96€ by February 2024. After reaching its lowest point in February and March 2024, it saw a gradual increase, reaching 104€ in June and July. Yet, there was another decline in August 2024, where it reached an ADR of 96€. From this data, it’s clear that there were some periodic trends with ADR increasing in the spring and summer months (May to July) and decreasing in the fall and winter months. Though it’s worth noting that there were atypical ADR decreases in August 2024.
RevPAR Summary
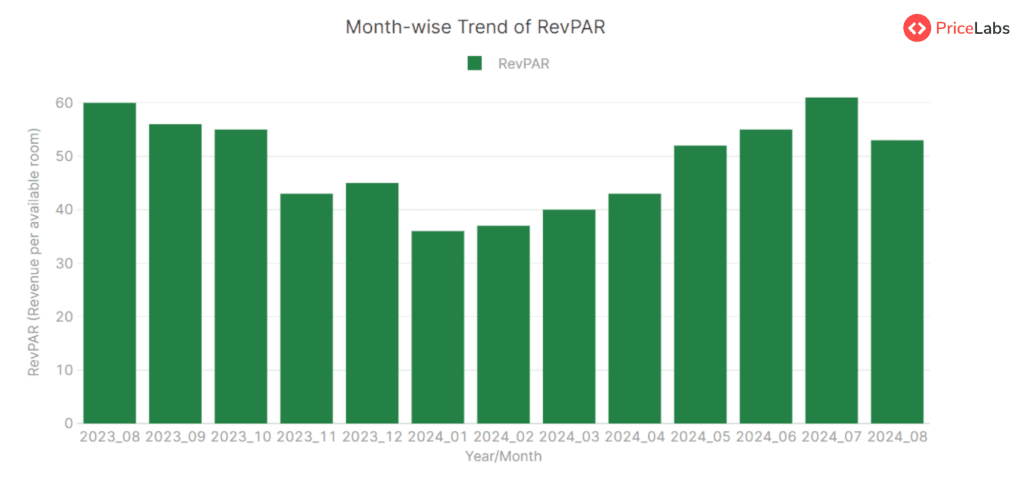
The RevPAR (Revenue Per Available Room) for Germany, represented in Euros (€), shows a varying trend from August 2023 to August 2024. In August 2023, the RevPAR was 60€, decreasing to 56€ in September 2023, then further reducing to 55€ in October 2023. A significant drop is evident as the RevPAR fell to 43€ by November 2023. December 2023 showcased a slight increase to 45€, but it descended significantly and continuously over the first few months of 2024. It reached the lowest of 36€ in January 2024, showing a little recovery to 37€ in February 2024. Following a minimal increase trend, the RevPAR climbed slightly to 40€ and 43€ in March and April 2024 respectively. There was a considerable rise in May 2024, landing at 52€, and continued to ascend to 55€ by June 2024. The peak was in July 2024 with a RevPAR of 61€. However, a considerable drop was noticed again in August 2024, where the RevPar was 53€. From this, it is discernible there is a seasonal trend, where the RevPAR tends to drop towards the end and beginning of the year and increases in the middle months, suggesting higher hotel occupancy during summer months of the year.
Read here: How to Calculate RevPAR.
Occupancy Rate Summary
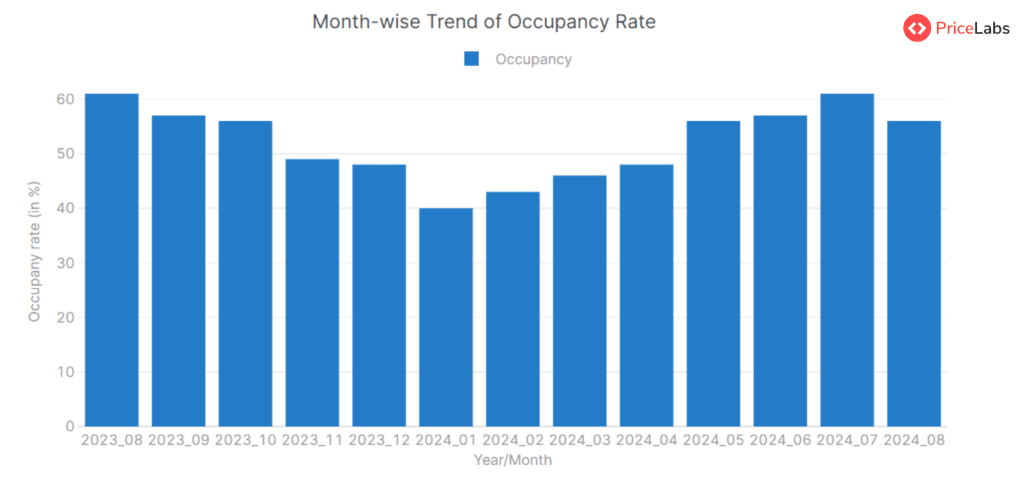
The occupancy data from Germany for the period between August 2023 and August 2024 reveals a fluctuating trend. The occupancy started at 61% in August 2023, then dropped to a low of 40% in January 2024, over a 5-month deteriorating trend. This downward trend was followed by a slow, steady increase to reach a peak of 61% in July 2024, maintaining an occupancy percentage not less than 40% throughout this time. The data concludes in August 2024 with a slightly lower occupancy rate of 56%. This pattern may imply a certain seasonality in the data, with higher occupancy rates observed in summer months (July – August), declining in fall and winter, and slowly recovering through spring.
Read here: How to Calculate Occupancy Rate.
Avg. Bookings Summary
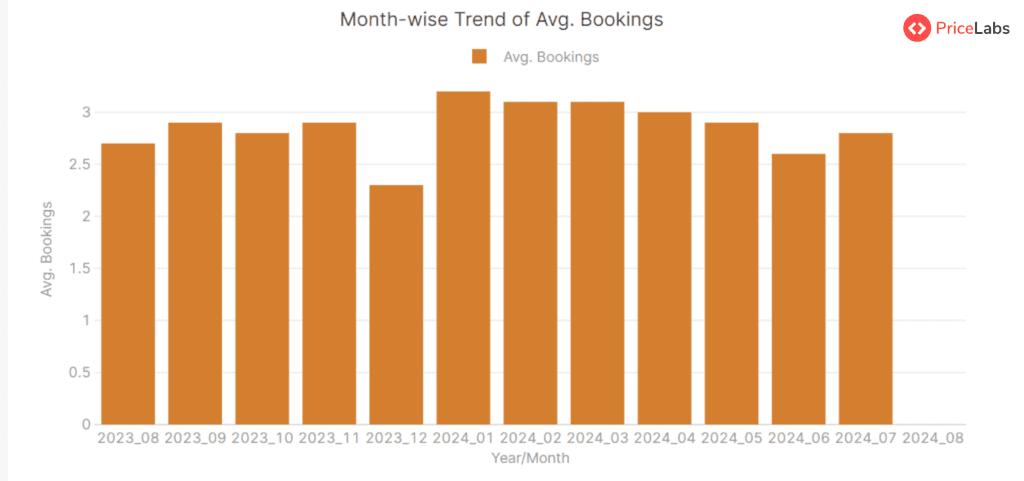
The average bookings in Germany showed a somewhat fluctuating trend from August 2023 to August 2024. In August 2023, the average bookings were recorded at 2.7, which slightly increased to 2.9 in September 2023. This then dipped slightly to 2.8 in October 2023 but rose again to 2.9 in November 2023. December 2023 saw a drop to 2.3, the lowest point during this period.
However, the start of 2024 observed an increase in average bookings, reaching 3.2 in January, slightly decreased to 3.1 in February and sustained the same value till March 2024. It then slightly dropped to 3 in April 2024 and fluctuated down to 2.9 in May. June 2024 saw another drop to 2.6, but picked up again to 2.8 in July. Notably, there were no average bookings recorded for August 2024.
The fluctuations suggest no specific seasonal/periodic trend in the average bookings for the country during this period.
Count of Active Listings Summary
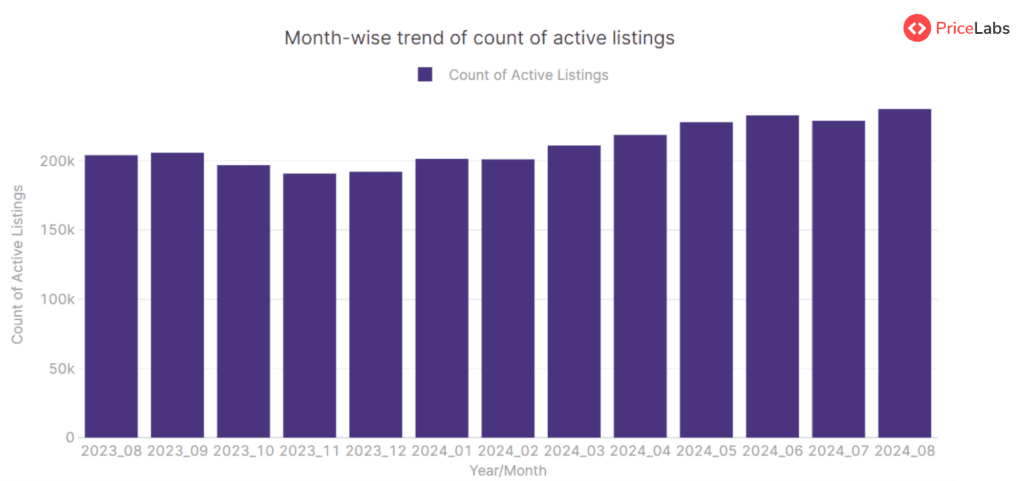
The count of active listings in Germany initially showed a slight rise in the period from August to September 2023, followed by a decrease until December 2023. From January 2024, there has been an overall upward trend in the number of active listings. There was a slight dip in July 2024, but the count continued to increase in the subsequent month. Note that though the count of active listings fluctuates month to month, the general trend over the specified period has been an increase.
Get actionable market insights from PriceLabs’ Market Dashboards.
About Short-term Rental Index
The World STR (Short-term Rental) Index by PriceLabs is a free tool for tracking short-term rental market performance worldwide. It offers data from Airbnb markets worldwide, refreshed monthly. You can access free insights on which locations are gaining or losing popularity. Key features include:
- Compare: Compare year-over-year metrics like active listings, occupancy rates, RevPAR, and ADR.
- Trend: Visualize how metrics have changed over the past years.
- Pacing: Compare upcoming year metrics to the previous year for occupancy, ADR, and RevPAR.
Explore more FREE tools by PriceLabs here.
About PriceLabs
PriceLabs is a revenue management solution for the short-term rental and hospitality industry, founded in 2014 and headquartered in Chicago, IL. Our platform helps individual hosts and hospitality professionals optimize their pricing and revenue management, adapting to changing market trends and occupancy levels.
With dynamic pricing, automation rules, and customizations, we manage pricing and minimum-stay restrictions for any portfolio size, with prices automatically uploaded to preferred channels such as Airbnb, Vrbo, and 100+ property management and channel integrations.
Every day, we price over 300,000+ listings globally across 135+ countries, offering world-class tools like the Base Price Help and Minimum Stay Recommendation Engine. Choose PriceLabs to increase revenue and streamline pricing and revenue management. Sign up for a free trial at pricelabs.co today.