Pricing your property is a serious task. It requires careful consideration of various factors to maximize your market potential while ensuring an exceptional guest experience. Analyzing relevant data is important to running a successful short-term rental business. This is where Neighborhood Data for vacation rentals becomes invaluable for successful neighborhood market analysis.
By leveraging hyper-local data, Neighborhood Data offers quick and efficient market analytics tailored to your locality by analyzing similar listings. Understanding the nuances of your neighborhood can significantly influence your pricing strategy. Local demand, amenities, and market trends are important in determining the right property price to maximize occupancy and revenue.
With the right data, you can make informed decisions that enhance your property’s appeal and align with guests’ evolving expectations. Embracing this data-driven approach to your pricing strategy will help you capitalize on market opportunities effectively.
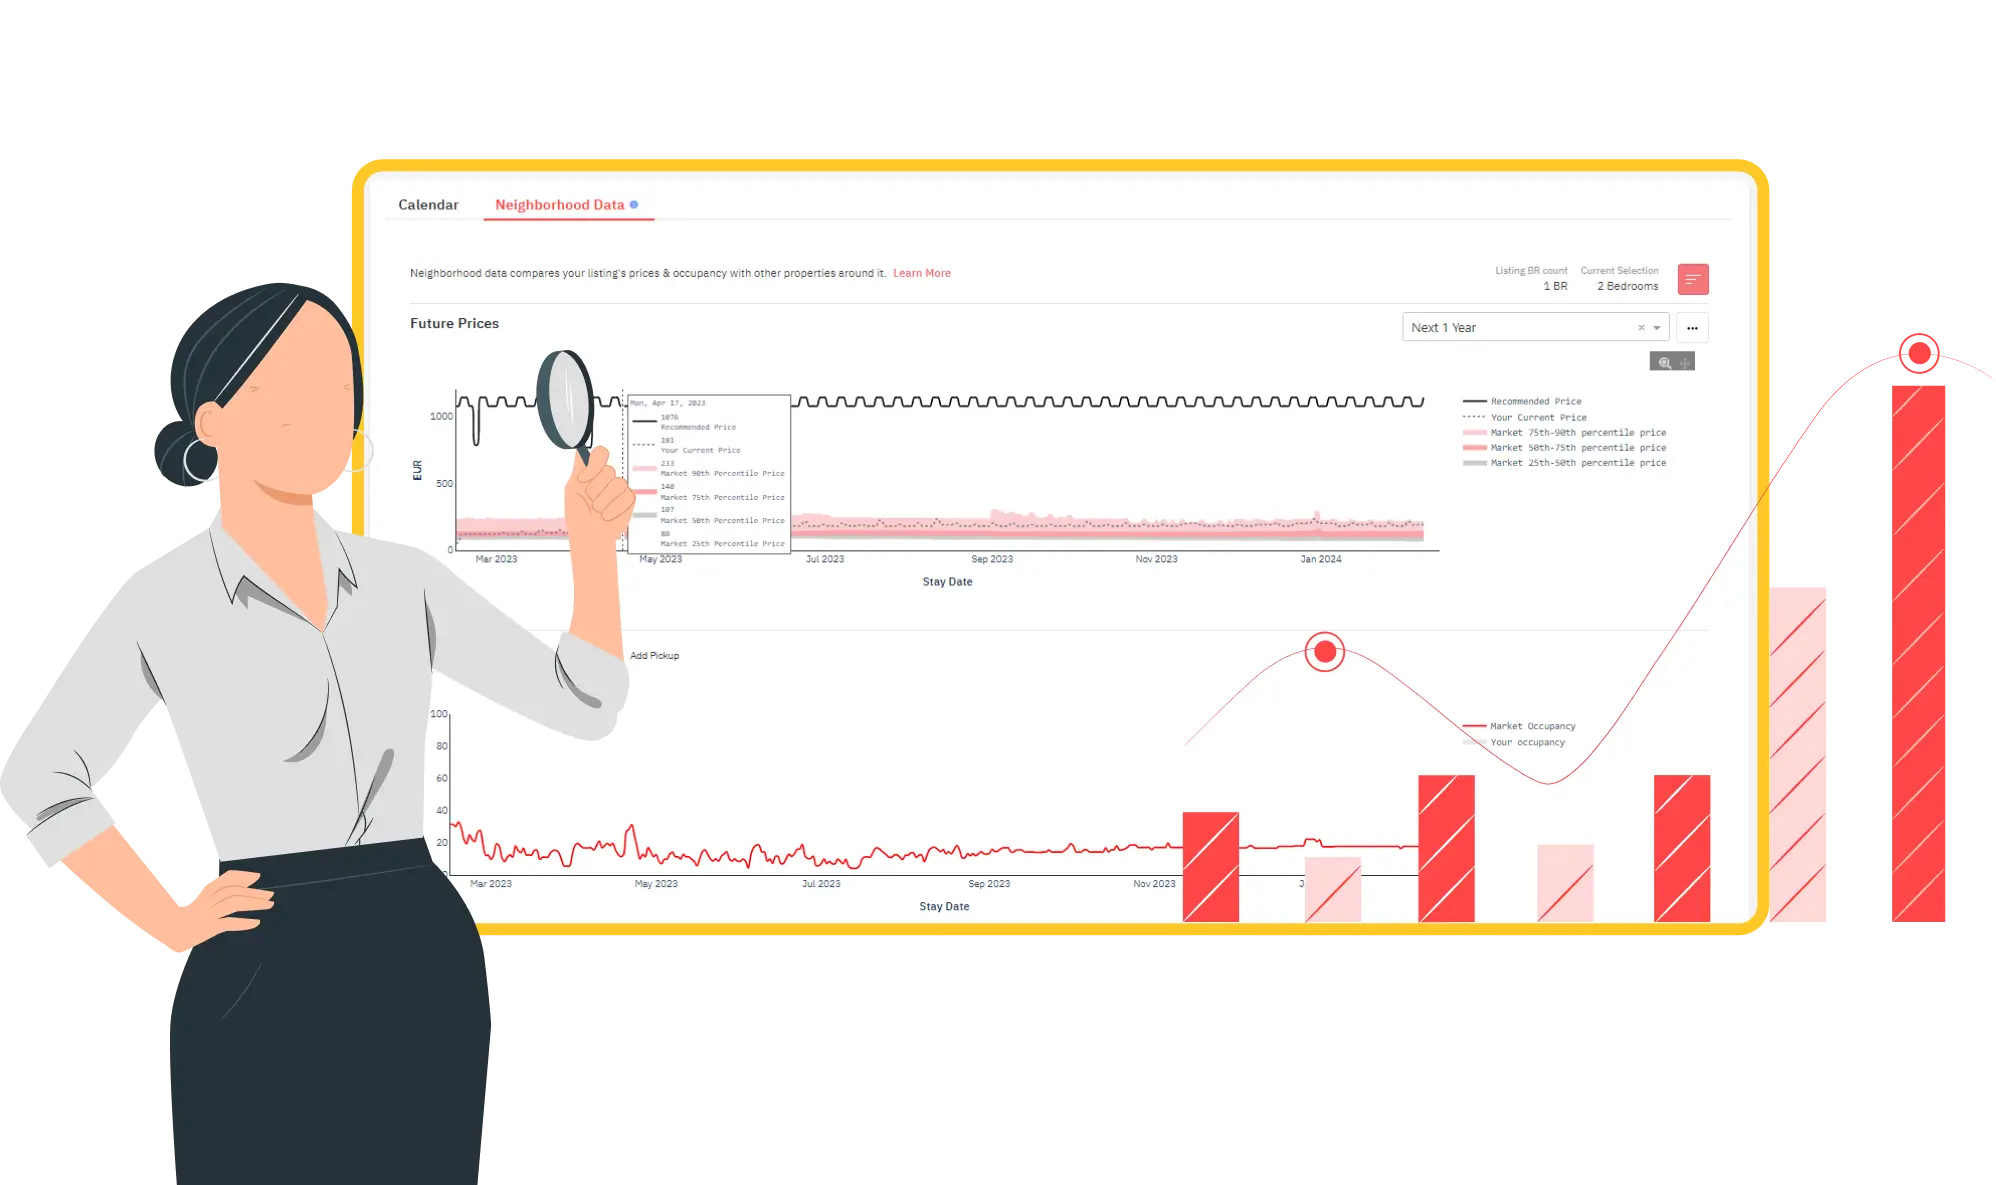
In the ‘Review Prices’ view, click the ‘Neighborhood Data’ tab next to the ‘Calendar’ to access hyper-local data in your currency.
Neighborhood data is in the Review Prices dashboard
Analyze the Effectiveness of Your Pricing Strategy
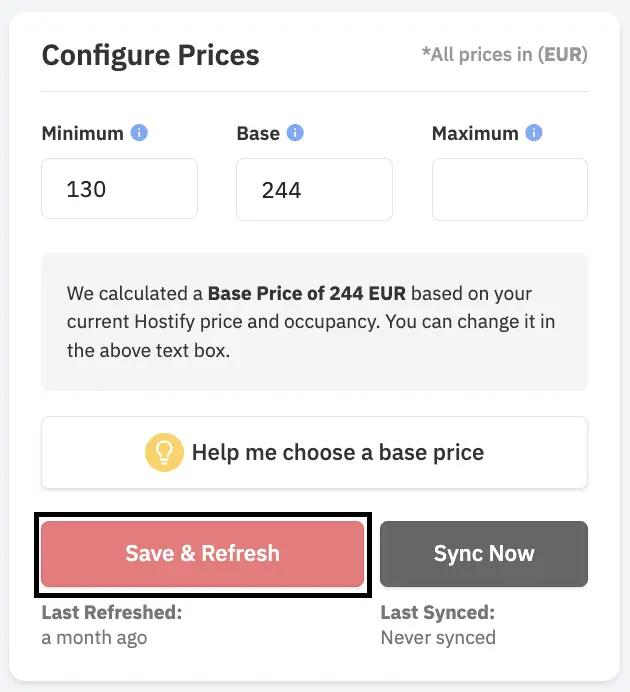
Let’s say you’ve just changed your Base Price or added a last-minute discount. You would want to understand if you’re still competitive by analysing neighborhood market analysis. Neighborhood Data for vacation rentals can help you with that. Whenever you make a change on PriceLabs, Click ‘Save and Refresh.’ This will save the changes you’ve made only in PriceLabs and not push them to the booking platforms/PMS you’ve connected.
Set your prices in the configure prices table
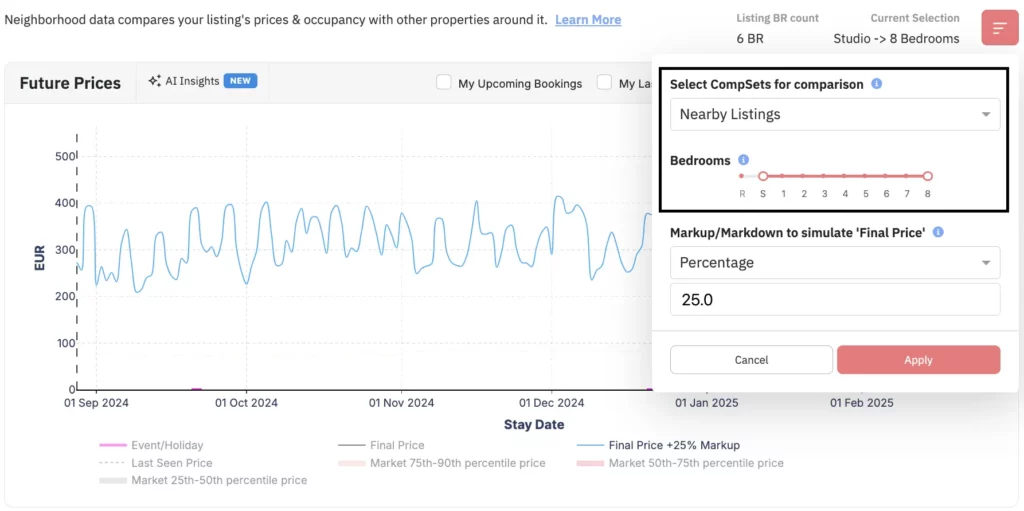
Now, go to Neighborhood Data and understand how these changes will affect your future prices. Look at the following charts for neighborhood market analysis:
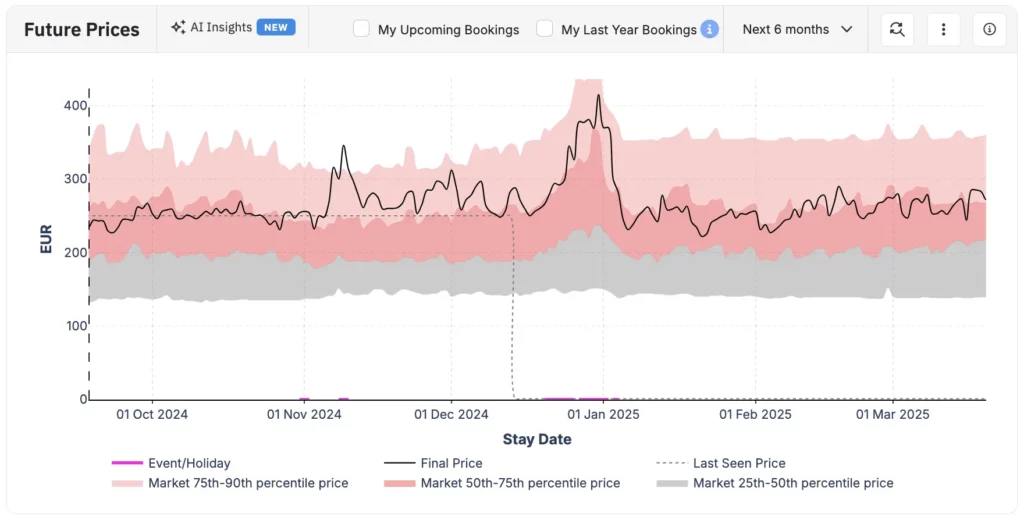
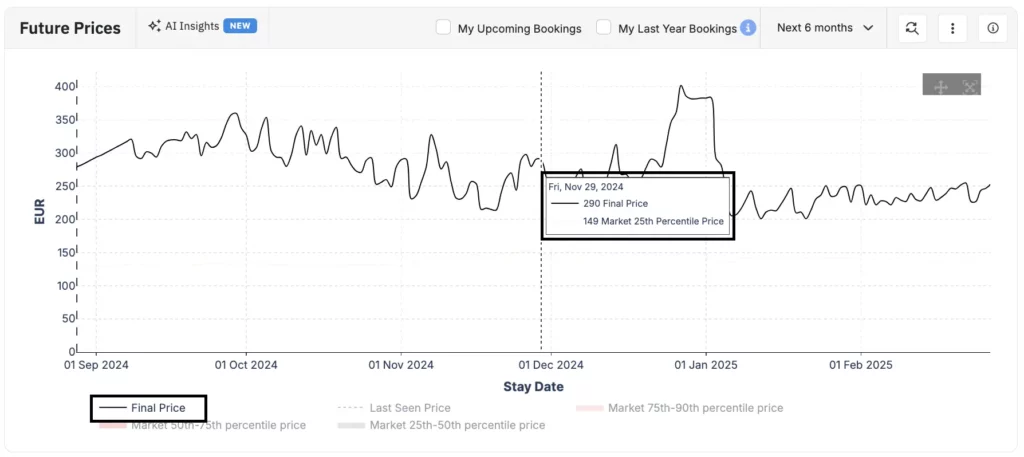
Use the Future Prices Chart to Understand the Effectiveness of Your Prices
Use the future prices chart to understand the effectiveness of your pricing strategy
The Base Price for this listing right now is €244. To understand if this pricing is feasible, I will go into the Future Prices chart and look at the Final Price chart. For example, on Nov 29, the pricing that would be pushed would be €290 for my listing. If this works, you can go ahead; if not, you must go back and make the necessary changes.
The final price graph will help you understand the evolution of your prices
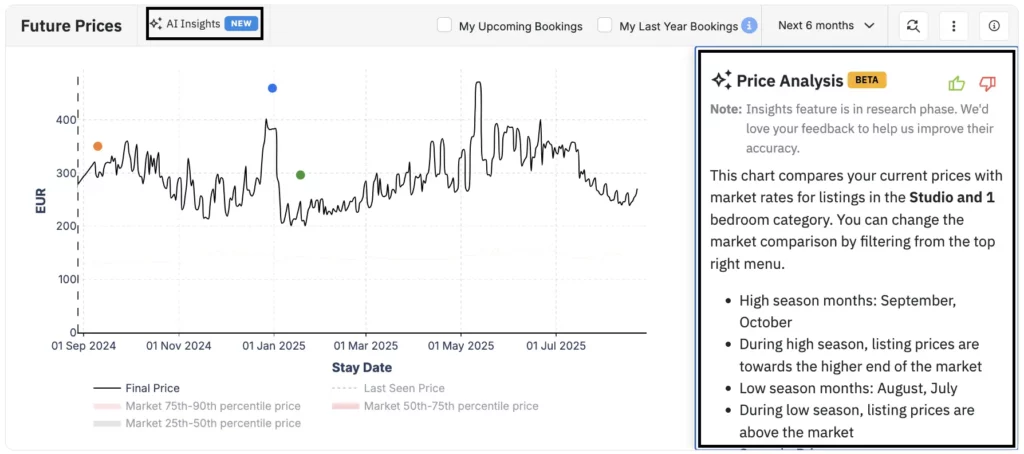
AI Insights Will Help You Easily Interpret Key Data from Our Charts
If understanding the graph is complicated, you can use our recently launched ‘AI Insights’ feature. AI Insights intelligently interprets data, helping you understand trends in Pricing and neighborhood market analysis for your selected time range. It can help you:
Convert charts into easy-to-understand sentences
Get key information within seconds!
AI insights provides quick and easy to understand analysis of each graph in Neighborhood Data.
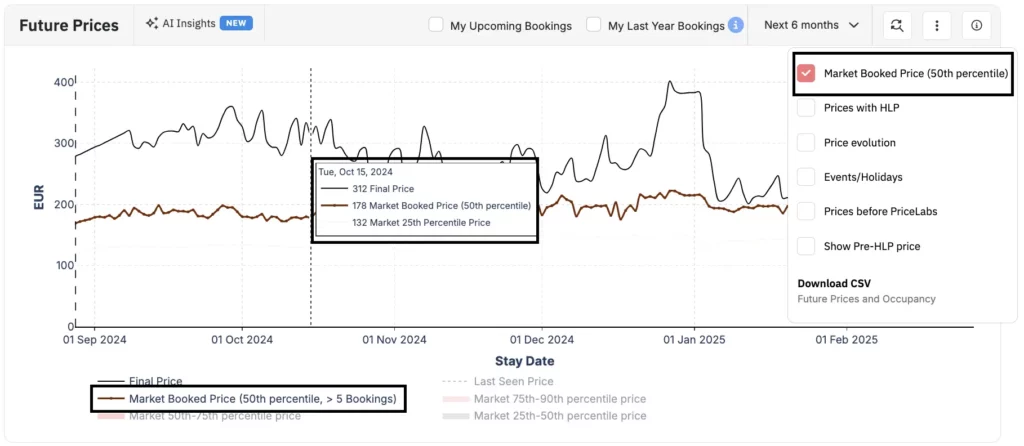
Compare your Prices Against Properties Already Booked for that Date
Market Booked Price will help you understand how the various properties in your market are being priced.
This information in our free Neighborhood Data can help you gauge the average price at which similar listings in your area were booked, especially around holidays or events. It allows you to adjust your revenue management strategy accordingly based on how far in advance the date is for accurate neighborhood market analysis. This feature is under ‘More Options’ on the Future Prices chart. When you select or check this option, a dark brown line will appear on the chart, indicating the median (50th percentile) price at which listings in the market were booked for each date.
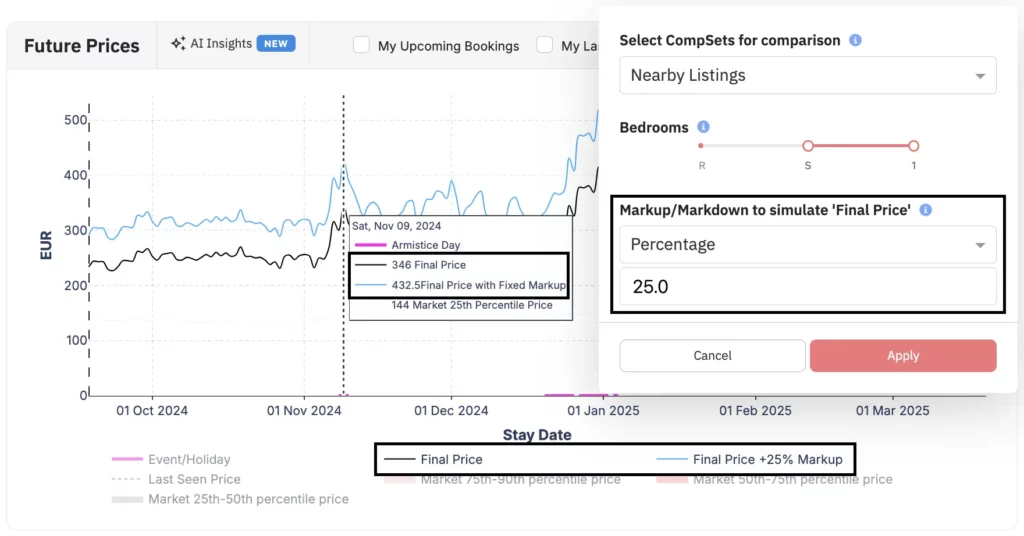
Consider Commissions in Your Pricing
The Markup feature will help you understand how your prices will evolve by also counting the fees in various booking platforms.
You might apply a markup on different booking channels/PMSs to cover fees when managing your listings. For instance, you could add a 15% markup on Airbnb and an 8% markup on Vrbo to account for Airbnb service fees and Vrbo host fees. This change in pricing could make it tricky for you to understand where you stand compared to your competition.
To simplify things, the Markup/Markdown feature in the Future Prices and Competitor Calendar graphs in our free Neighborhood Data lets you visualize your prices with a fixed or percentage adjustment. This way, you can simulate different scenarios and see where your nightly rate, plus any markup, lands in the market.
Once enabled, it will also appear in our Competitor Calendar (more on this below). This gives you a clearer picture of your competitive standing and allows for a straightforward comparison in neighborhood market analysis.
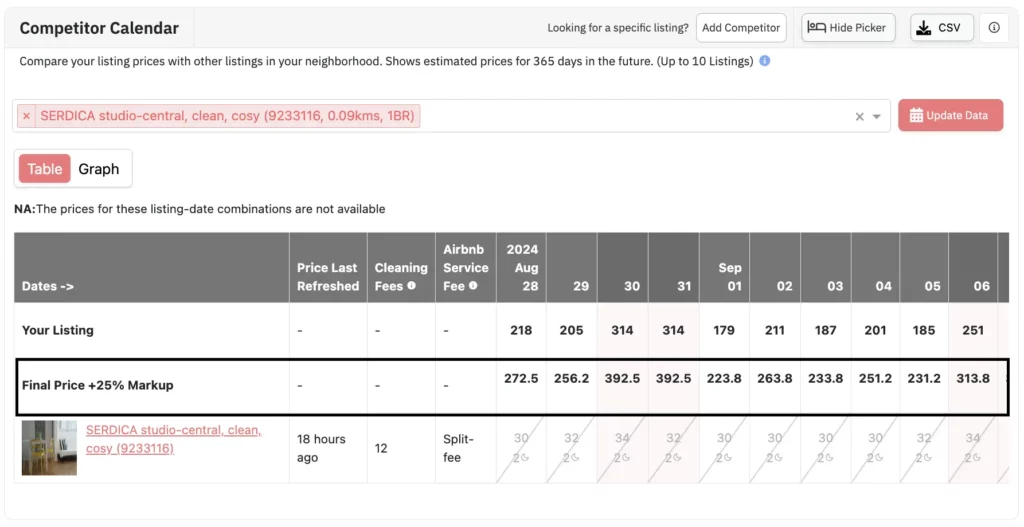
In the competitor calendar, you can compare your prices with your competitors along with the markup prices.
Conduct In-Depth Competitor Analysis for Informed Data-Driven Decisions
Compare your Pricing to Your Direct Competitors
When pricing your property, choosing the right competitors against whom to benchmark is important.
Compare your listing’s performance with nearby listings of your own choice.
You can use one of two available options in our Neighborhood Data for vacation rentals:
Nearby Listings – this is the default settings of PriceLabs. We look at 350+ listings in your locality that are similar to your property.
Market Dashboard: If you’ve created Market Dashboards, you can choose one of them here and further dissect it to have us examine a specific comp set within that Dashboard.
Suppose you’ve created a custom comp set in the Market Dashboard. In that case, you can use it to effectively compare rates for a new unique property in Neighborhood Data (ND), especially when traditional Portfolio Analytics (PA) methods aren’t viable until a reservation is made. This is particularly useful for properties with specific amenities like pools or professionally managed properties. Additionally, you can now include competitors from a broader area in the Compare Competitor Calendar (CCC), even if those properties were previously too distant in Neighborhood Data for vacation rentals for meaningful comparisons in your neighborhood market analysis.
Note: Market Dashboard is a separate product, so you will be charged extra. Once you’ve created a compset, view it once in the Market Dashboard to access it as a Data Source here. It might take overnight for it to load in this dashboard.
Compare the Calendar of your Competitors to Yours
Competitor Calendar will help you compare your listing’s performance with that of your competitors.
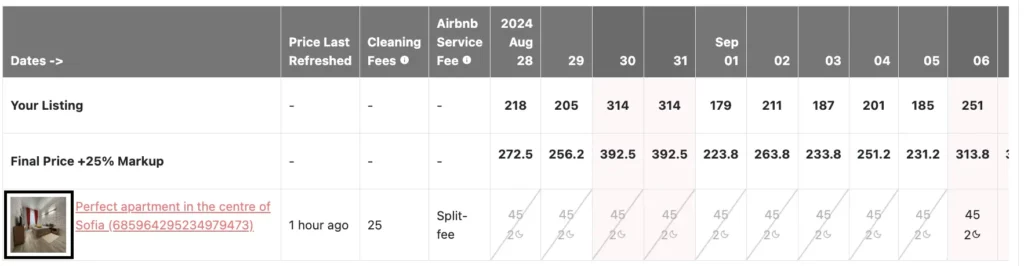
Once you’ve chosen a listing from the dropdown, a table with its details will appear. A few columns are in a different color because those are the weekend days we’ve set for this property (Friday, Saturday).
We have also added a thumbnail option so you can quickly check if you’ve pulled the right listing without having to move tabs each time.
In the thumbnail of the listing, you will find the cover picture of that listing.
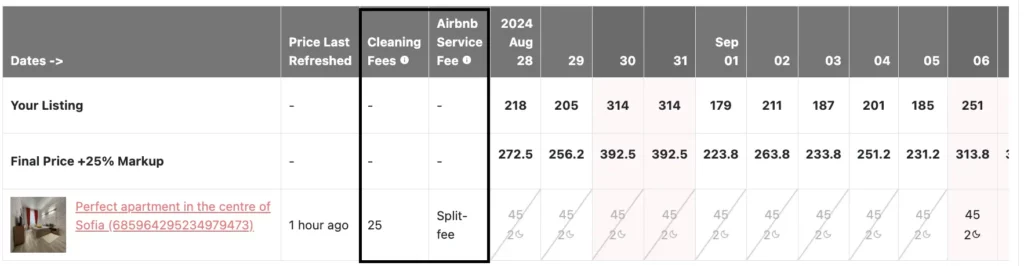
Compare Your Fees with your Competitors’ Fees
You can also compare Airbnb Service Fee and Cleaning Fees of your competitors with yours.
You might have noticed a difference between the pricing we push and the pricing you notice on Airbnb or Vrbo. This might be because of cleaning fees and other service fees. This is solved with the Markup option. We have also added an option for you to understand your competitors’ fees for their property.
This allows you to compare the overall price and the specific fees your competitors charge for their property making your neighborhood market analysis more holistic.
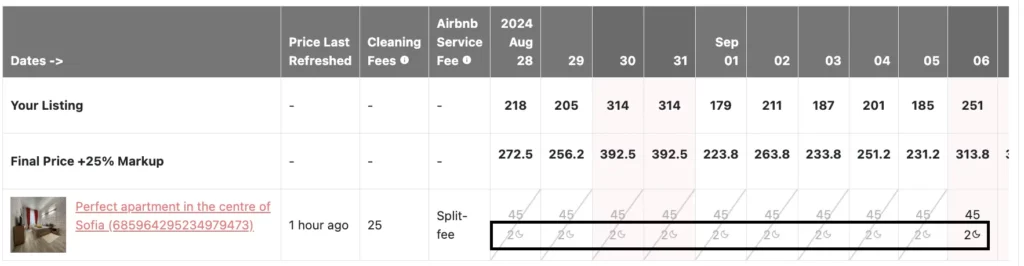
Compare the Minimum Stay Restrictions of Your Competitors
You can also compare minimum night restrictions of your competitors with yours.
Check out your competitors’ minimum stay settings each night and tweak your settings as needed. This will help you understand further about the changes in your neighborhood market analysis strategy that you might need to make.
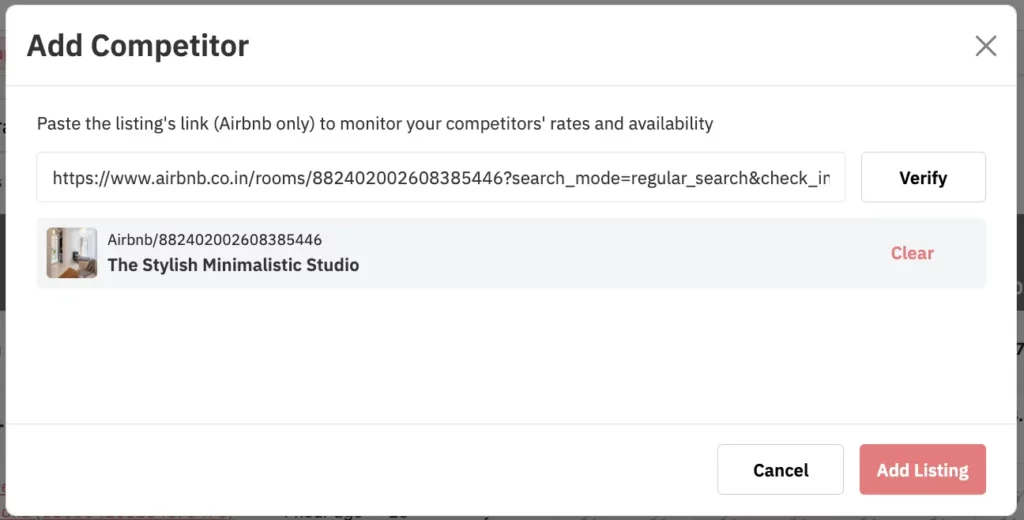
Pro Tip: If you’ve constantly been eyeing a particular property on Airbnb and wish you could perform the same way, add that listing to our Competitor Calendar to benchmark your performance against it.
If you don’t find a competitor in the list, you can also add your competitors to our list.Once you’ve added the link of that listing, verify it and add it to your competitor calendar.
Conduct Quick and Efficient Neighborhood Analysis
While you’ve analyzed your property’s analysis and reviewed it with the performance of other properties in your neighborhood, it is important to understand how the entire market performs.
Use the Market History Section to Understand the Performance of Key Metrics in the Market
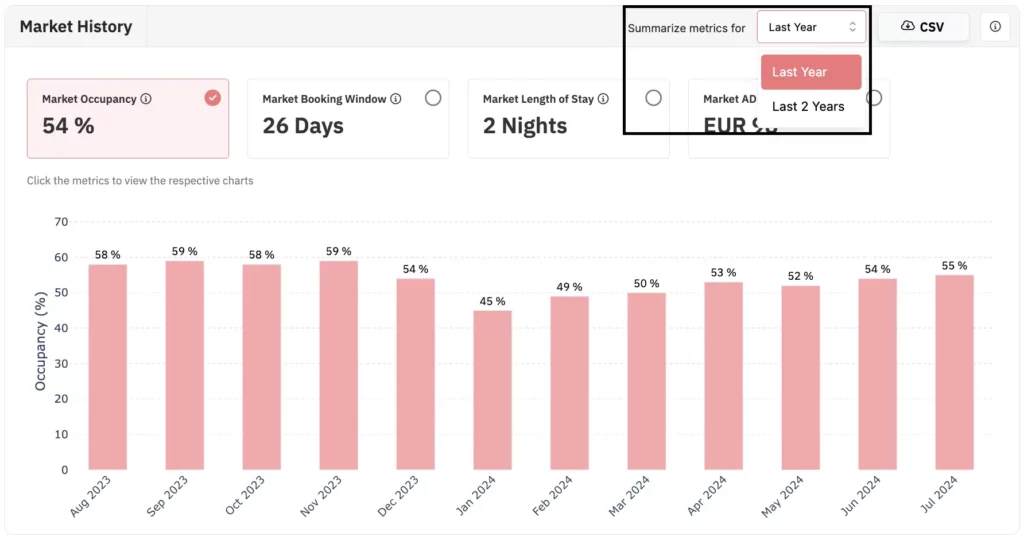
The Market History chart shows your market’s Occupancy, Booking Window, Average Daily Rate (ADR), and Length of Stay. By default, the chart shows data for the last year but can be changed to show data for the previous two years.
To view each metric above, click the option at the chart’s top. By default, we provide data for the last year. However, you can choose to get data for the last two years.
In the Market History tab, you can understand your market’s Key Performance Indicators.
The metrics that you can analyze through this chart:
Market Occupancy: This shows you the average (mean) occupancy of other listings in your area for each month in the past 12 or 24 months. You can use this to benchmark your performance against competitors regarding occupancy.
Market Booking Window: This shows the number of days between the date the booking is made and the first stay date. You can use this to understand your lead time, which will help you prepare your property for each stay.
Market Length of Stay: This shows the number of nights guests stay per reservation. The metric shown here is the median of how long clients stay per booking.
Market ADR: ADR is the total revenue divided by the number of booked nights. This graph shows the median of the average nightly price of the listings in your neighborhood.
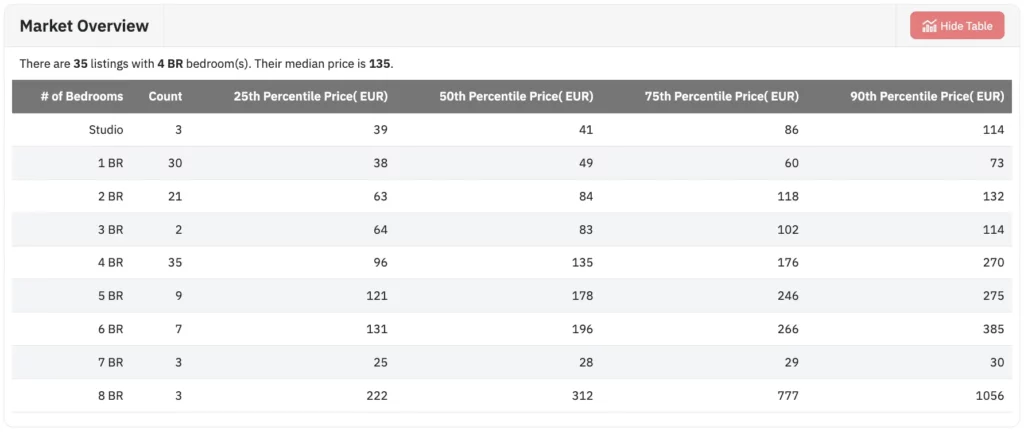
Find the Precise Count of Listings and Their Average Pricing
This table will provide a precise count of listings by the number of bedrooms.
This chart provides the precise count of listings by the number of bedrooms and displays the average low, mid, and high prices for these listings, considering their prices over the past 180 days and for the next 180 days. Among the 35 four-bedroom listings in this area, the median price is €135, the pricing at the lower end is €96, and at the higher end, it is € 270.
Pricing Your Property Is Important: We Understand That!
When guests are considering a short-term rental, price is a major factor in their decision-making process, making it crucial for you to set competitive rates. If your prices are too high, you risk not filling your property as often as you’d like. Conversely, setting your rates too low might lead to occupancy but also mean missing out on potential revenue. To ensure you adopt an effective pricing strategy, you must analyze key vacation rental KPIs in detail. The goal is to find that sweet spot where your pricing strategy attracts guests while maximizing your earnings.
Dynamic pricing in Airbnb refers to the practice of adjusting rental rates in real time based on various factors such as demand, seasonality, local events, and market conditions. This approach allows hosts to optimize their earnings by automatically increasing or decreasing prices to match supply and demand fluctuations. By utilizing data and algorithms, dynamic pricing aims to find the optimal balance between attracting guests and maximizing revenue, ensuring that prices reflect the current market dynamics.
To implement dynamic pricing for vacation rentals, collect relevant data, identify key factors, set pricing rules, use dynamic pricing software, monitor performance, and adjust as needed to optimize revenue.
The aim of dynamic pricing is to optimize revenue and occupancy rates. It is done by adjusting prices in real time based on factors such as demand, market conditions, competition, and other variables. Dynamic pricing softwares seeks to find the optimal balance between attracting guests and maximizing profitability by dynamically setting prices that reflect current market dynamics. The goal is to capture the highest possible value for each booking while ensuring competitiveness in the market.
0%
Get started with PriceLabs
Want to learn what PriceLabs can do for you? See for yourself with a free trial