


Key Takeaways
The data provided using PriceLabs’ STR Index represents the short-term rental performance metrics for the Ile-de-France region in France from January 2021 to January 2024. Throughout this period, all observed metrics show a general upward trend, indicating positive short-term rental market performance.
- Average Daily Rate (ADR) increased from 104€ in January 2021 to 164€ in January 2024, and Revenue per Available Room (RevPAR) also experienced a similar rise from 33€ to 89€.
- Occupancy rates grew as well, starting from 32% at the beginning of 2021 and reaching 54% by the start of 2024, though it saw a peak of 73% in June 2023.
- Average bookings also grew generally, ranging from 1.3 to 4.
- There’s an overall upward trend in the count of active listings as well, rising from 58284 in January 2021 to 100713 in January 2024, indicating an increase in accommodation availability within the region.
- Seasonality might influence these trends, with higher values usually observed in the warmer months. This suggests growth in STR performance in the Ile-de-France region during the observed period.
ADR Summary

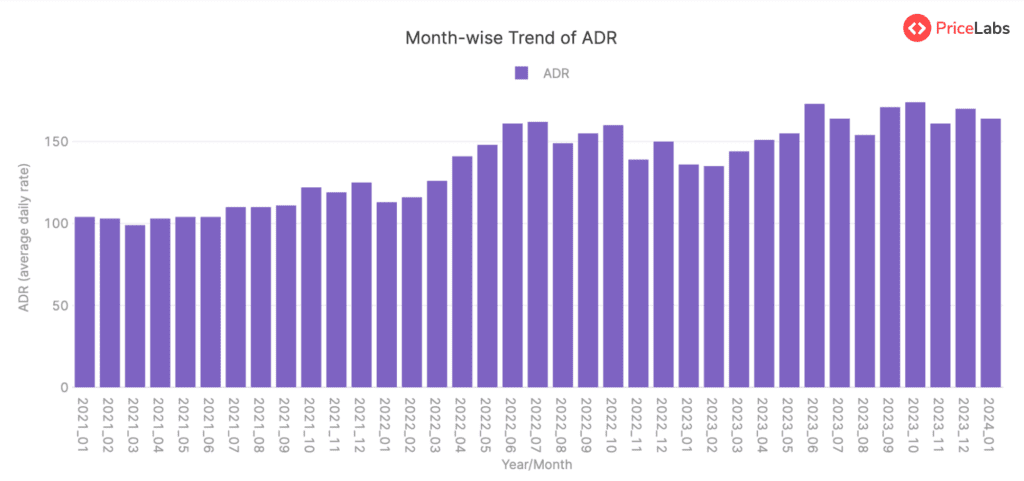
The Average Daily Rate (ADR) represented in euros (€) for the Ile-de-France region of France has shown an overall upward trend from January 2021 to January 2024, according to the given data. Starting from 104€ in January 2021, the ADR saw a slight drop to 99€ in March 2021 before rebounding to 103€-104€ in April-June 2021. There was a consistent increase from July to December 2021, with the ADR reaching 125€ in December.
The growth continued into 2022 with an intermittent seasonal dip in August (149€) after peaking at 162€ in July. The ADR reached another high point of 160€ in October before declining again to 139€ in November and rebounding to 150€ in December.
In 2023, the ADR continued this pattern of growth amidst minor fluctuations, again with a seasoned dip during the second half of the year. But, it peaked in June at 173€, which is the highest value across the given timeframe, then again decreased to 154€ in August before picking up yet again to 174€ in October and closing the year at 170€ in December. January 2024 data shows the ADR at 164€.
The pattern suggests that the ADR generally increases around the middle of the year, with consistent growth noted from the start of each year until around July/August, before reducing slightly towards the latter part of the year. This kind of fluctuation might be due to seasonal variations in tourism and travel in the Ile-de-France region.
RevPAR Summary
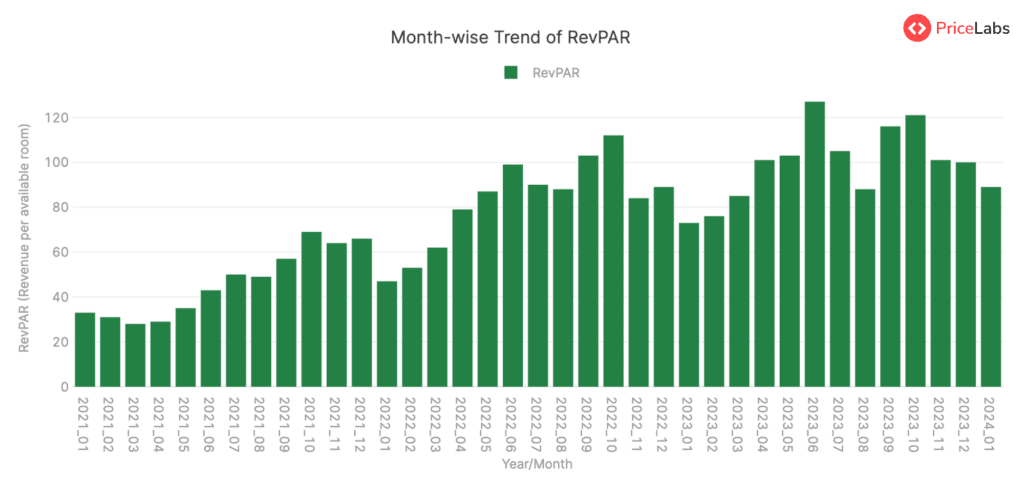
The RevPAR (Revenue per Available Room) in the Ile-de-France region of France, expressed in Euros (€), exhibited an overall growing trend from January 2021 to January 2024. Starting at a value of 33€ in January 2021, it decreased slightly to 28€ in March but then steadily increased, reaching a peak of 69€ in October 2021.
Thereafter, a minor decrease was observed until January 2022, when it was 47€. However, from this point forward, it steadily increased again, meeting a new peak of 112€ in October 2022. A slight decrease was noted in the following months, with November and December standing at 84€ and 89€, respectively.
The year 2023 started with a RevPAR of 73€ in January, which peaked at 127€ in June. Thereafter, a significant downturn occurred, down to 88€ in August. However, a recovery towards the end of the year was observed, with the RevPAR reaching 121€ in October 2023. A slight slump was observed towards the year-end, with December recording a RevPAR of 100€.
The year 2024 opened with a RevPAR of 89€ in January. Seasonality can be observed with the RevPar tending to increase around the middle of the year and decrease towards the year-end and at the beginning of the year.
This trend analysis is respectively aligned with active listings and occupancy rates. However, the RevPAR evolution seems more marked by a general increase over time, particularly from 2021 to late 2023, showing increased returns for the hospitality industry in this region.
Read here: How to Calculate RevPAR.
Occupancy Rate Summary
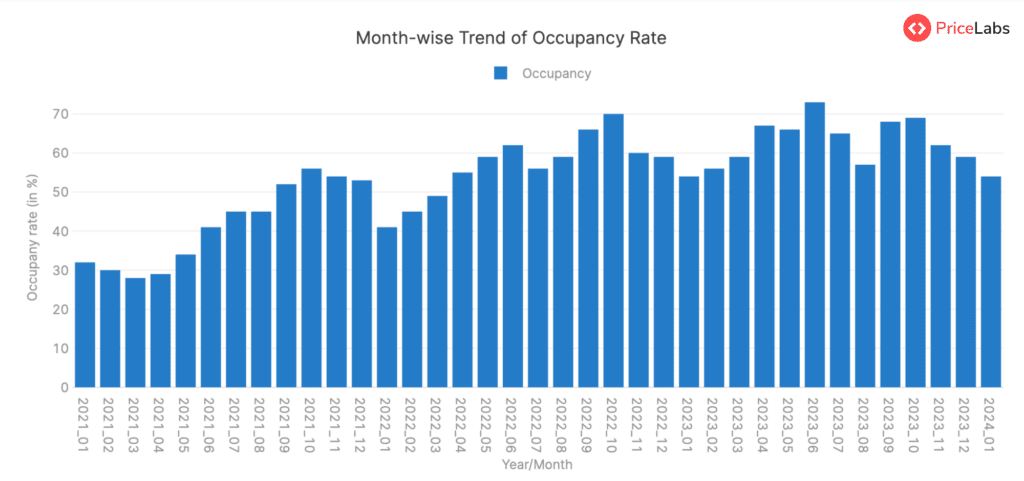
The occupancy rate in the Ile-de-France region of France has generally shown a steady increase over time from January 2021 to January 2024, highlighting the rising popularity and utilization of accommodations in the region, contributing to enhanced short-term rental market performance.
In early 2021, the occupancy rate was around 30% to 32%, gradually increasing by a few percentage points each month until it reached a notable 41% in June 2021. The occupancy rate continually grew, reaching a peak of 56% in October 2021.
Moving into 2022, the numbers followed a similar upward trend. The occupancy started at around 41% in January 2022 and reached a new high of 70% in October 2022.
In 2023, the occupancy rates continued to increase. Starting at 54% in January 2023, the occupancy rate spiked to 73% in June, the highest rate throughout the entire period before it dropped to 57% in August, then increased again and reached a peak of 69% in October.
In January 2024, the occupancy rate was reported at 54%. This entire upward trend demonstrates an annual cyclical pattern with occupancy rates spiking around mid-year and toward the end of the year, particularly from April to October.
Read here: How to Calculate Occupancy Rate.
Avg. Bookings Summary
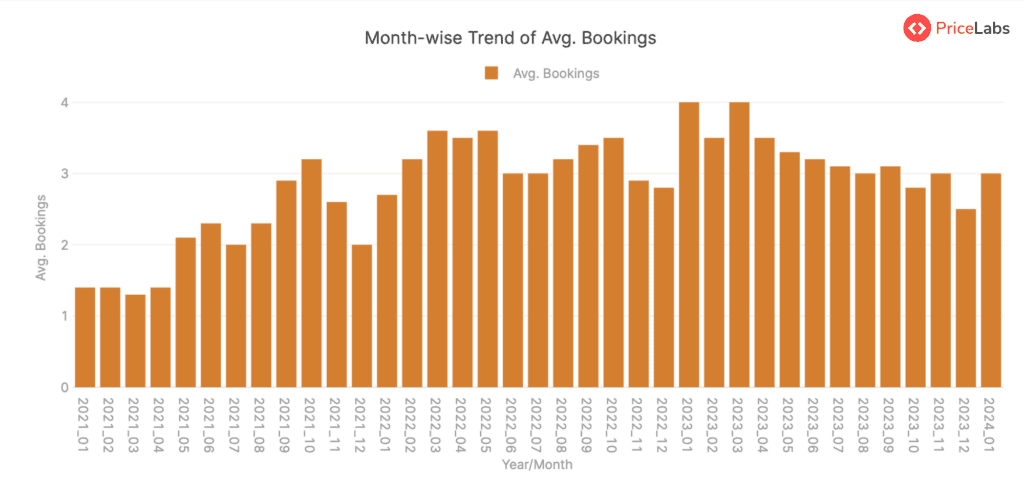
Analyzing the average bookings data for the Ile-de-France region in France, there has been a general upward trend in the first half of the years from 2021 to 2024. The average bookings started at 1.4 in January 2021 and slowly increased, reaching a peak of 3.2 in October 2021. However, there was a slight dip in the bookings in December 2021, and then again, a steady increase was observed throughout the first half of 2022, reaching up to 3.6 in May 2022.
Post this, the bookings somewhat fluctuated, but still maintained a steady figure around 3 till the third quarter. In October 2022, the figure again rose to 3.5, but then it showed a reduction pattern towards the end of 2022. In January 2023, another upward trend was initiated, reaching its highest figure in the given data, 4, in March 2023. This was followed by a period of slight fluctuations and a generally decreasing trend till the end of 2023.
After starting 2024 with average bookings of 3, no further data is available for the comparison, but considering the previous years’ trend, we can infer that it might follow a similar pattern.
It’s quite clear that there is a seasonal trend in the average bookings, with the first half of the years generally having higher average bookings and then reducing at the year’s end, demonstrating dynamic short-term rental market performance.
Count of Active Listings Summary
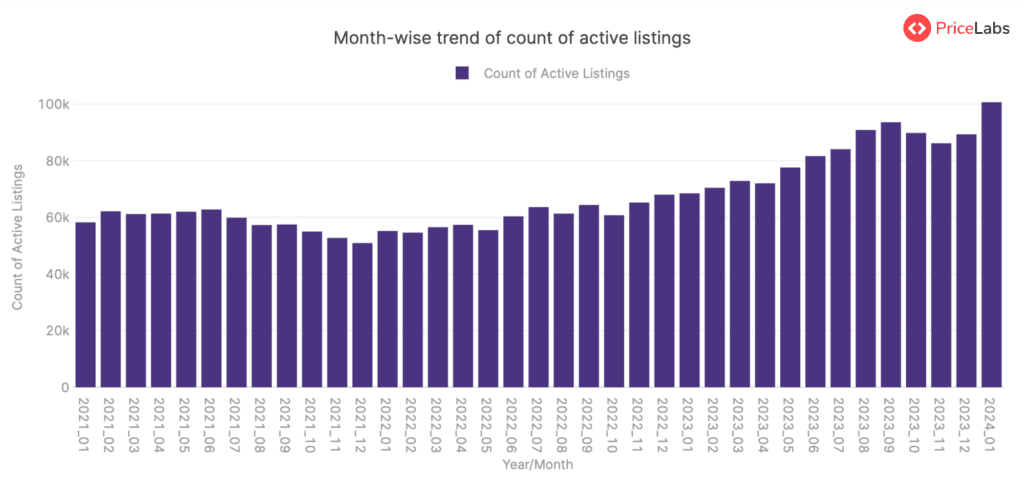
The active listings in the region have shown an overall increasing trend from January 2021 to January 2024. In January 2021, there were 58,284 active listings. This number saw small fluctuations in subsequent months, reaching a local peak of 62,830 in June 2021 before decreasing to a local low of 50,965 in December 2021.
In the subsequent year, 2022, the count of active listings again began to increase, with a peak of 64,426 in September and a dip to 60,804 in October, but overall, the year ended with more listings (68,072) than it started.
In the year 2023, the count of active listings saw consistent growth from 68,529 in January 2023, peaking at 93,644 in September 2023. Despite a slight decrease in the last quarter of 2023, the count remained substantially higher than the previous years. By January 2024, the count of active listings reached 100,713, marking a significant growth over the three years from 2021.
This trend suggests a growing number of accommodations becoming available in the Ile-de-France region over three years. This growth indicates a burgeoning market with expanding accommodation options, contributing to the region’s short-term rental market performance.
Get actionable market insights from PriceLabs’ Market Dashboards.
About Short-term Rental Index
The World STR (Short-term Rental) Index by PriceLabs is a free tool for tracking short-term rental market performance worldwide. It offers data from Airbnb markets worldwide, refreshed monthly. You can access free insights on which locations are gaining or losing popularity. Key features include:
- Compare: Compare year-over-year metrics like active listings, occupancy rates, RevPAR, and ADR.
- Trend: Visualize how metrics have changed over the past years.
- Pacing: Compare upcoming year metrics to the previous year for occupancy, ADR, and RevPAR.
Explore more FREE tools by PriceLabs here.
About PriceLabs
PriceLabs is a revenue management solution for the short-term rental and hospitality industry, founded in 2014 and headquartered in Chicago, IL. Our platform helps individual hosts and hospitality professionals optimize their pricing and revenue management, adapting to changing market trends and occupancy levels.
With dynamic pricing, automation rules, and customizations, we manage pricing and minimum-stay restrictions for any portfolio size, with prices automatically uploaded to preferred channels such as Airbnb, Vrbo, and 100+ property management and channel integrations.
Every day, we price over 300,000+ listings globally across 135+ countries, offering world-class tools like the Base Price Help and Minimum Stay Recommendation Engine. Choose PriceLabs to increase revenue and streamline pricing and revenue management. Sign up for a free trial at pricelabs.co today.