
Updated: October 21, 2024
Key Takeaways
- The provided data belongs to Italy for one year, from September 2023 to August 2024.
- The Average Daily Rates (ADR) varied between 129€-153€, with the highest being July 2024.
- Revenue per Available Room (RevPAR) ranged from 38€-89€ and peaked in July 2024.
- Interestingly, although August 2024’s ADR was 143€ (10€ lower than July 2024), the RevPAR performance was still high at 84€, indicating efficient room profitability.
- The Occupancy rate was the highest in July 2024, at 61%, followed by August, with 59%. The average bookings fluctuated between 1.9 and 3.4, with the highest values in March, April, and May 2024.
- The Count of Active Listings increased over time, starting from 522,921 in September 2023 to 568,144 by August 2024. There was a significant rise from May to June 2024. Generally, performance indicators (ADR, RevPAR, and Occupancy) seem stronger in the Summer months (June-August) compared to the rest of the year.
ADR Summary
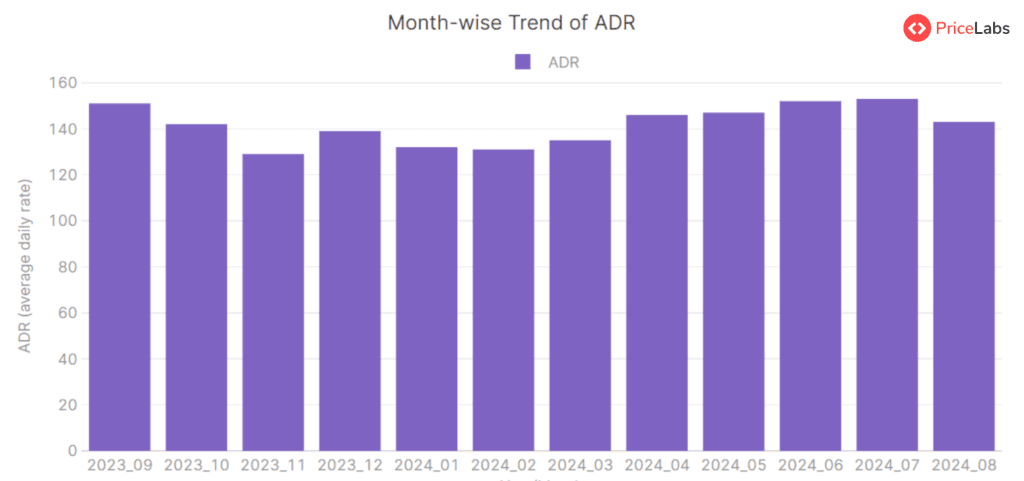
The Average Daily Rate (ADR) in Italy, represented in euros, has shown several fluctuations from September 2023 to August 2024. In September 2023, the ADR was 151€, which decreased to 142€ in October 2023. The ADR followed a decreasing trend to reach the lowest point of 129€ in November 2023. However, it increased to 139€ in December 2023, before falling to 132€ in January 2024. From February to March 2024, an upward trend was noted with the ADR value increasing from 131€ to 135€. The months from April to July 2024 witnessed a consistent increase in the ADR, peaking at 153€ in July 2024. However, In August 2024, the ADR slipped again to 143€.
Additionally, a seasonal trend can be loosely identified wherein the ADR seems to generally increase from the early months of the year to reach a high around the middle of the year (June/July), before falling again towards the end of the year.
RevPAR Summary
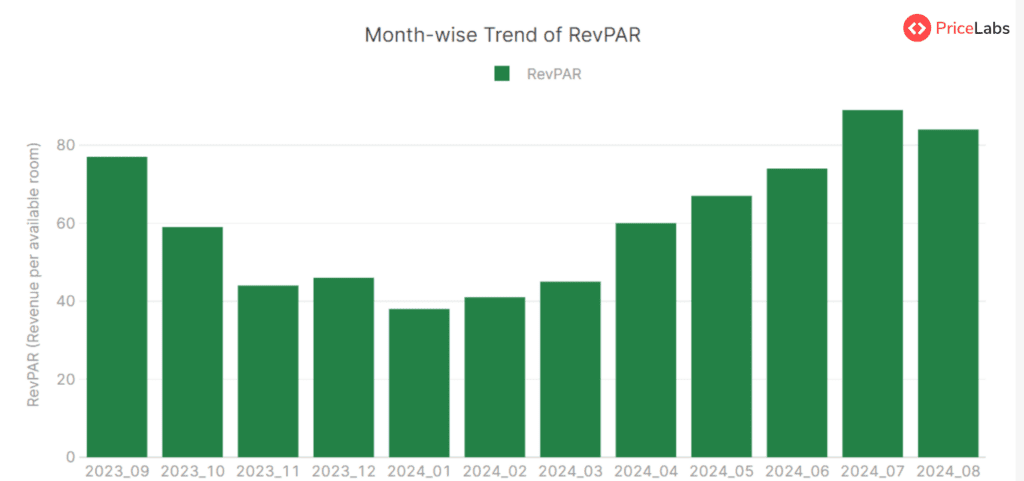
The historical trend of Revenue Per Available Room (RevPAR) in Italy, represented in Euros (€), shows some seasonal fluctuation over the assessed period from September 2023 to August 2024. During September 2023, RevPAR stood at 77€, which then fell to 59€ in October 2023 and dipped further to 44€ in November 2023. The RevPAR slightly increased to 46€ in December 2023.
However, there was a continued decrease in RevPAR at the beginning of 2024, with 38€ in January, but showed a slight recovery to 41€ in February 2024 and further improved to 45€ in March 2024. Starting from April 2024 with a RevPAR of 60€, there was a noticeable rise with a continued increase in the subsequent months. May 2024 revealed a RevPAR of 67€, which further amplified to 74€ in June 2024.
In July and August 2024, the RevPAR peaked at 89€ and 84€, respectively, suggesting the summer months might be the high season for Italy’s accommodation sector. In summary, the past trend of RevPAR in Italy has shown a tendency to dip in the later part of the year and early months of the following year, with a significant increase during the summer months.
Read here: How to Calculate RevPAR.
Occupancy Rate Summary
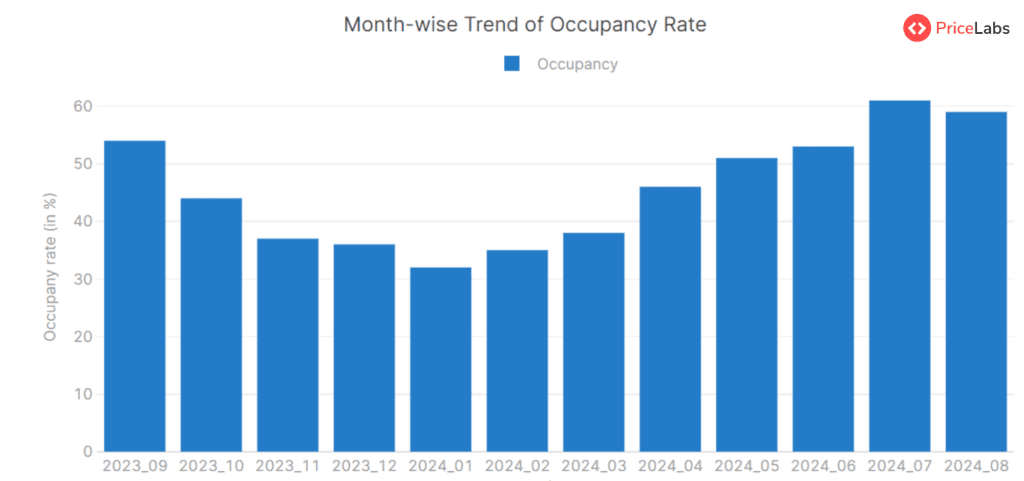
The occupancy rates for properties across Italy followed a periodic, downward pattern from September 2023 to February 2024, then gradually increased from February to August 2024. In September 2023, the occupancy rate was recorded at 54%. After this, occupancy continuously decreased until February 2024, hitting a low of 32% in January 2024. The observed downward occupancy trend during these months could be attributed to seasonal variations in the country.
However, from February 2024, occupancy rates steadily rose, reflecting the start of the tourism season or other factors popularising Italy as a destination. The occupancy rates increased progressively every month, from 35% in February 2024 to 61% in July 2024, indicating a significant rise in demand. After that, in August 2024, a slight dip was noted to 59%.
Thus, the occupancy rates demonstrated a cyclical trend, with lower rates observed in the winter months (from November to February) and higher rates during the summer months (from May to August), indicating the potential impact of seasonal factors on accommodation occupancy. Please note that the analysis is strictly based on the provided data.
Read here: How to Calculate Occupancy Rate.
Avg. Bookings Summary
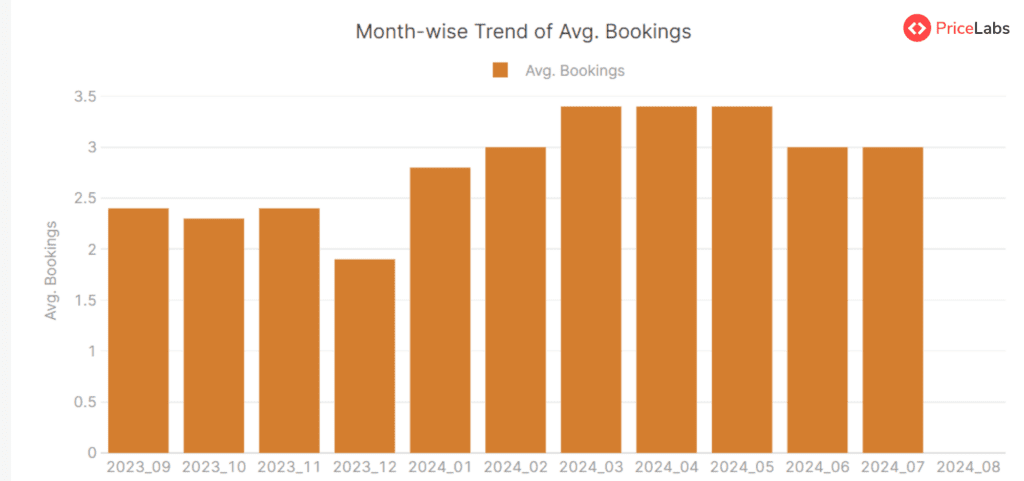
In Italy, the trend in average bookings has seen some fluctuation over the given period. In September 2023, the average was 2.4 bookings, declining slightly to 2.3 in October 2023, but then returning back to 2.4 in November 2023. However, there was a drop to 1.9 bookings in December 2023. Starting from January 2024, there was a gradual upward trend in average bookings, starting with 2.8 bookings increasing gradually to reach 3.4 bookings per month in March, April, and May 2024. This trend persisted until May 2024, post which the average bookings slightly decreased to 3 in June and July 2024. In August 2024, there were no average bookings recorded. This could suggest a possible seasonal trend where the bookings decrease in the winter (December), increase towards the spring and early summer (from January to May), and again decrease in the mid-summer (June and July), completely dropping off by the end of summer (August).
Count of Active Listings Summary
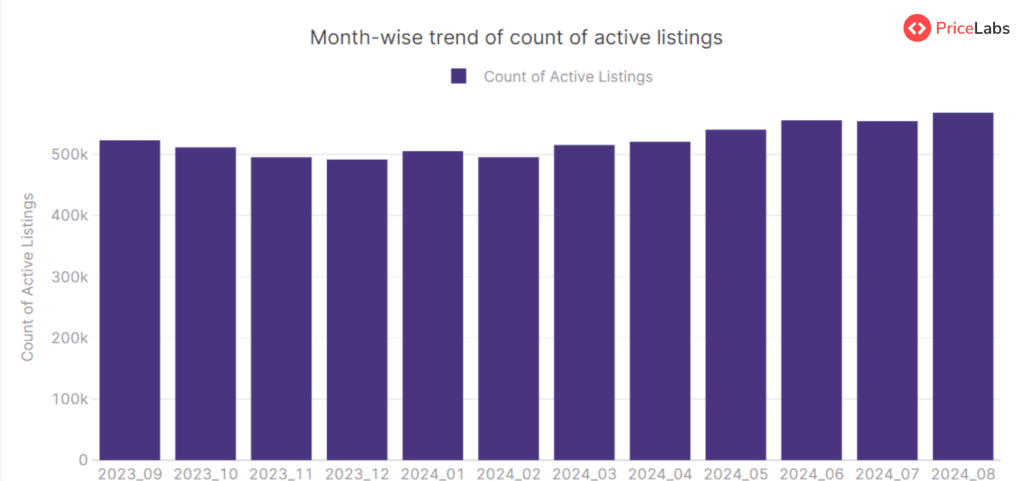
The count of active listings in Italy showed a general decreasing trend from September 2023 to December 2023, dropping from 522,921 to 491,458. However, a gradual increase began from January 2024, with the count rising to 515,261 by March 2024. The trend continued, and by May 2024, the count of active listings had leaped to 540,296. The highest count of active listings was observed in August 2024, with 568,144 listings. The only slight decline during this period was in July 2024, when the count of listings dropped to 554,176 from 555,637 in June, but the numbers picked up again in August 2024.
Get actionable market insights from PriceLabs’ Market Dashboards.
About Short-term Rental Index
The World STR (Short-term Rental) Index by PriceLabs is a free tool for tracking short-term rental market performance worldwide. It offers data from Airbnb markets worldwide, refreshed monthly. You can access free insights on which locations are gaining or losing popularity. Key features include:
- Compare: Compare year-over-year metrics like active listings, occupancy rates, RevPAR, and ADR.
- Trend: Visualize how metrics have changed over the past years.
- Pacing: Compare upcoming year metrics to the previous year for occupancy, ADR, and RevPAR.
Explore more FREE tools by PriceLabs here.
About PriceLabs
PriceLabs is a revenue management solution for the short-term rental and hospitality industry, founded in 2014 and headquartered in Chicago, IL. Our platform helps individual hosts and short-term rental professionals optimize their pricing and revenue management, adapting to changing market trends and occupancy levels.
With dynamic pricing, automation rules, and customizations, we manage pricing and minimum-stay restrictions for any portfolio size, with prices automatically uploaded to preferred channels such as Airbnb, Vrbo, and 110+ property management systems and channel integrations.
Every day, we price over 400,000+ listings globally across 135+ countries, offering world-class tools like the Base Price Help and Minimum Stay Recommendation Engine. Choose PriceLabs to increase revenue and streamline pricing and revenue management. Sign up for a free trial at pricelabs.co today.