Updated: February 27, 2024
Key Takeaways
The provided data exhibits monthly trends over three years (2021 to 2024) in the Lombardy region, Italy, providing insights into the short-term rental market performance.
- The trends in Average Daily Rate (ADR) indicate an overall increase from 97€ in January 2021 to 135€ in January 2024.
- The Revenue per Available Room (RevPAR) showed a similar upward trajectory, rising from 21€ in January 2021 to 62€ in January 2024.
- The occupancy rate was variable, seeing its lowest in January 2021 at 22% and peaking in August for both 2022 and 2023 at 71% and 68%, respectively.
- The number of active listings also displayed an overall uptrend from 36,595 in January 2021 to 50,576 in January 2024, indicating a growing Airbnb market.
- The average bookings in the same period ranged between 1 and 4.4.
- Thus, Lombardy, Italy, exhibited promising growth in its Airbnb sector with increased ADR, RevPAR, average bookings, and a fluctuating but relatively high occupancy rate.
ADR Summary
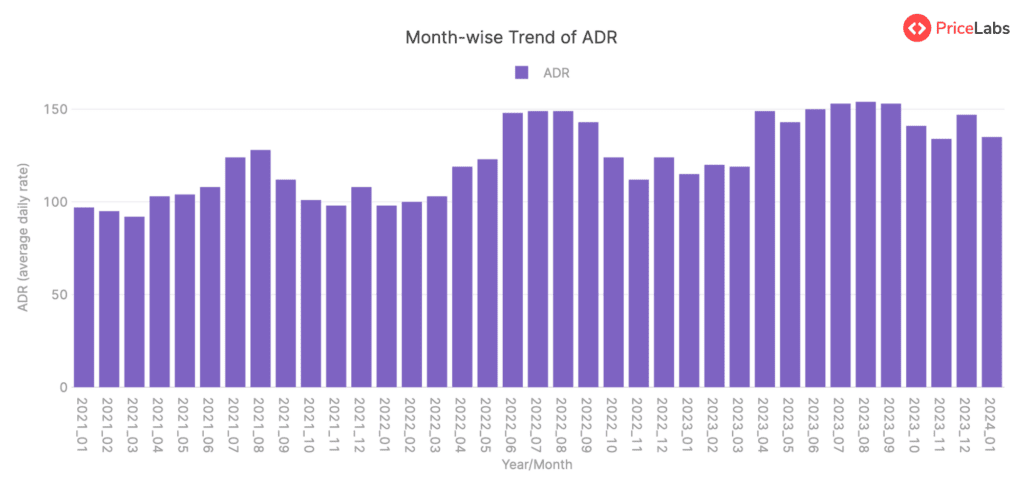
The Average Daily Rate (ADR) trend in Lombardy, Italy, depicted a general upward growth from January 2021 to January 2024. The ADR started at 97€ in January 2021, with slight fluctuations in the subsequent months before reaching a peak of 128€ in August 2021. Post this, the ADR saw a decline until it again bumped up to 108€ in December 2021.
The beginning of 2022 steadily climbed, with a significant leap to 148€ and 149€ in June and July, respectively. Around the middle of the year, particularly in August, the rate peaked at 149€ before experiencing a decrease in the last quarter of 2022. The year concluded at an ADR of 124€ in December.
The upward trajectory regained momentum in 2023, initiating an ADR of 115€ in January and progressively elevating to 154€ in August – the highest recorded ADR in the given data. A gradual decline towards the end of the year followed this peak.
The beginning of the year 2024 saw a decrease in ADR to 135€ in January from 147€ in December 2023.
Overall, there seems to be a seasonal pattern in the ADR trend, with the highest rates typically observed in mid-year (particularly around August), followed by a decrease towards the end of the year, showcasing the cyclical nature of Italy short-term rental performance.
RevPAR Summary
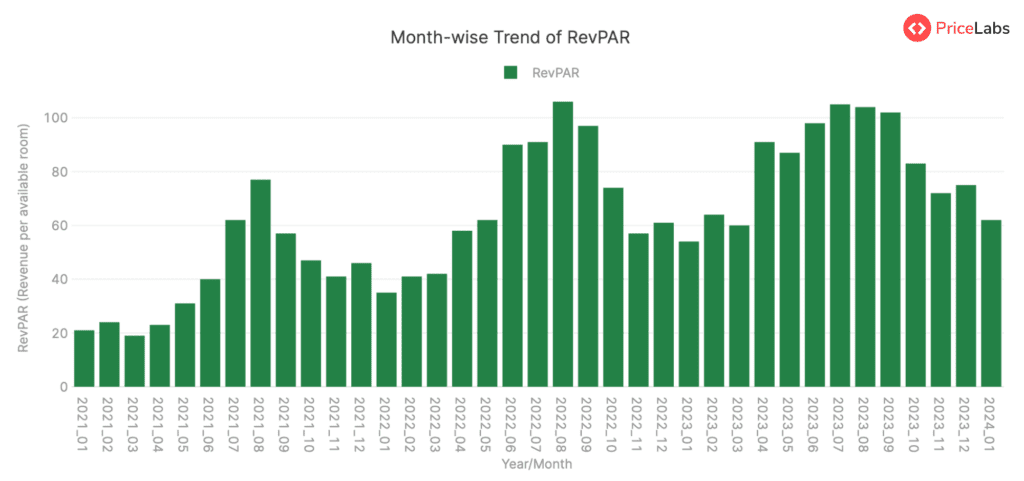
The RevPAR in Lombardy, Italy, has shown a general upward trend over the past few years. Starting at 21€ in January 2021, it fluctuated somewhat in the early part of the year, reaching a low of 19€ in March 2021 before starting a more consistent rise. By August 2021, the RevPAR had more than tripled to 77€, marking an impressive increase.
However, it declined slightly to 57€ in September 2021. It fluctuated until February 2022, when it reached 41€ before again showing an ascent, hitting 106€ by August 2022, marking the highest point in the given period. After this, there were small fluctuations, but the RevPAR remained relatively high for the rest of the year, ending at 61€.
In January 2023, the RevPAR was 54€ and followed a similar yearly pattern. The RevPAR again hit a peak in August 2023, reaching 104€. The RevPAR ended at 62€ in January 2024 after experiencing similar fluctuations at the end of 2023.
This data suggests some degree of seasonality, with peaks in the summer months and troughs in the winter, indicating cyclical patterns within the short-term rental market performance. However, the overall trend is towards growth, with each summer showing higher RevPAR than the last, barring minor fluctuations.
Read here: How to Calculate RevPAR.
Occupancy Rate Summary
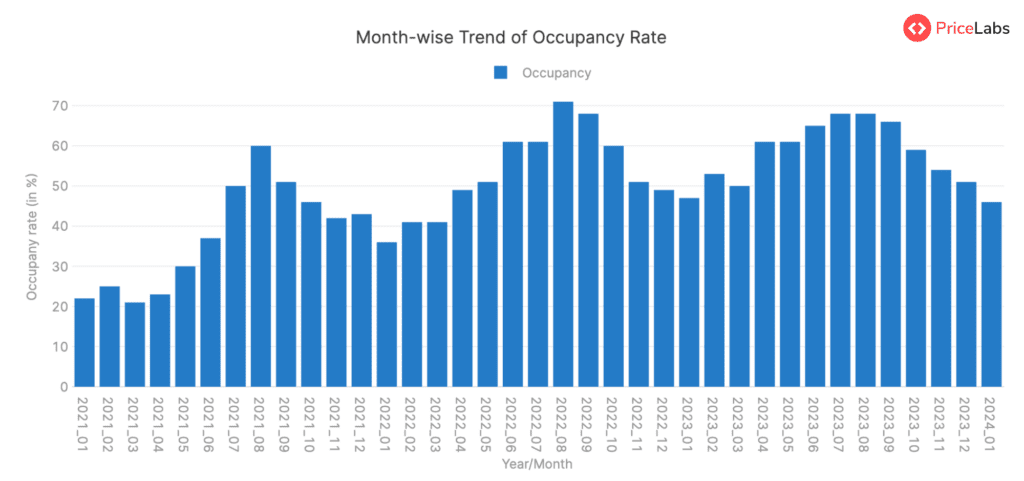
From 2021 to 2024, the occupancy in the Lombardy region of Italy exhibited a general increasing trend. Starting at 22% in January 2021, it dipped slightly to 21% in March, only to pick up with noticeable growth during the summer months, peaking at 60% in August 2021.
Following this, it declined to around the mid-forties in fall and early winter before rising mildly in the early months of 2022. From February 2022 onwards, the region saw progressive growth, reaching another summit of 71% occupancy in August of the same year.
This pattern of peak occupancies during the summer months, slight drops in the transition seasons (fall and spring), and more pronounced dips during winter appeared to be repeated in the following years, indicating a strong seasonal trend. Notably, the lowest occupancy rates were often seen in winter, specifically in late 2021 and early 2024, with rates around 22% and 46%, respectively.
However, despite slight fluctuations, the overall trend observed is of increasing occupancy within this period. The summer months showed an incremental increase in occupancy rates year on year, reaching 68% in 2023, further evidencing the general upward trend.
Read here: How to Calculate Occupancy Rate.
Avg. Bookings Summary
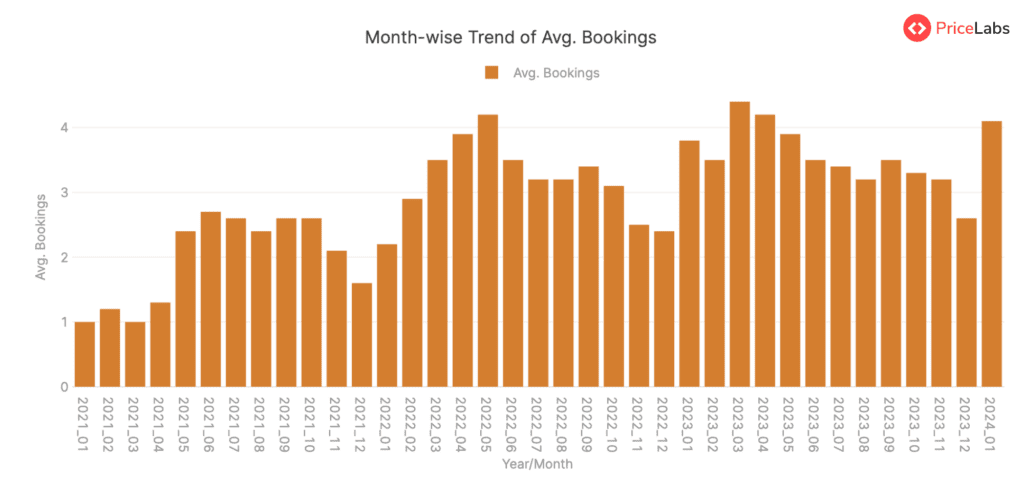
The average bookings in the Lombardy region of Italy saw an upward trend from January 2021 until May 2022, indicating positive short-term rental market performance. Starting from an average of 1 booking and peaking at an average of 4.2 bookings, this trend reflects increasing demand within the rental market. Following this, the average bookings showed a slight decline, reaching 2.4 bookings by December 2022.
A similar pattern was repeated from January 2023, where average bookings gradually increased, peaking at 4.4 bookings in March 2023. Subsequently, it started declining again, hitting 2.6 bookings by December 2023.
Another rise was noted in the bookings until January 2024, when the average bookings hit 4.1.
In summary, a periodic trend is observed in the average bookings in Lombardy, with an annual cycle of increase till around mid-year followed by a decrease until the year-end.
Count of Active Listings Summary
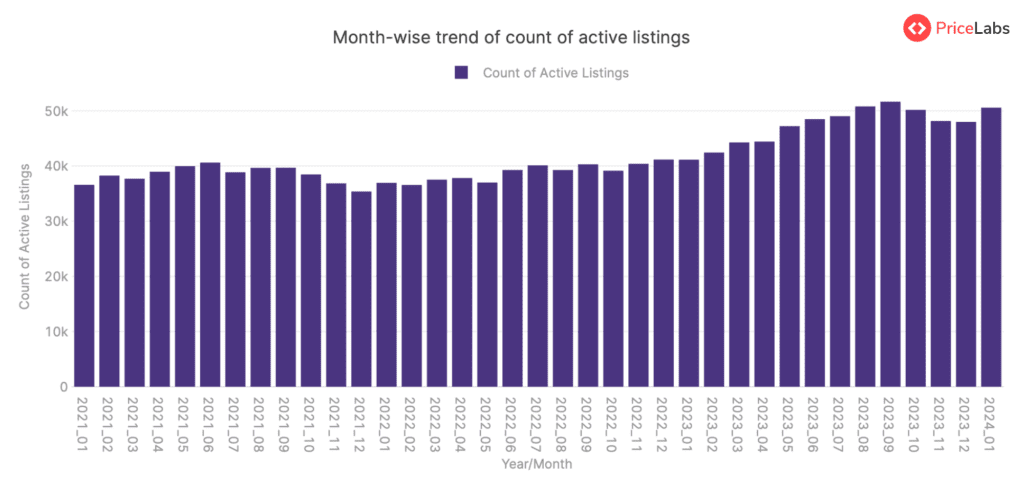
The count of active listings in the Lombardy region of Italy showed an overall increasing trend from January 2021 to January 2024. The count started from 36,595 in January 2021 and reached 50,576 listings by January 2024. The figures fluctuated throughout this period but showed the most significant growth between May 2023 and August 2023. During this time, the number of active listings increased from 47,231 to 50,810. After reaching its peak in September 2023 with 51,662 active listings, there was a slight drop in the next few months.
Although there were some periods of decrease, such as between June 2021 to July 2021 and October 2023 to November 2023, the overall trend indicates growth and expansion in the count of active listings in the Lombardy region over these three years, reflecting positive short-term rental market performance.
Get actionable market insights from PriceLabs’ Market Dashboards.
About Short-term Rental Index
The World STR (Short-term Rental) Index by PriceLabs is a free tool for tracking short-term rental market performance worldwide. It offers data from Airbnb markets worldwide, refreshed monthly. You can access free insights on which locations are gaining or losing popularity. Key features include:
- Compare: Compare year-over-year metrics like active listings, occupancy rates, RevPAR, and ADR.
- Trend: Visualize how metrics have changed over the past years.
- Pacing: Compare upcoming year metrics to the previous year for occupancy, ADR, and RevPAR.
Explore more FREE tools by PriceLabs here.
About PriceLabs
PriceLabs is a revenue management solution for the short-term rental and hospitality industry, founded in 2014 and headquartered in Chicago, IL. Our platform helps individual hosts and hospitality professionals optimize their pricing and revenue management, adapting to changing market trends and occupancy levels.
With dynamic pricing, automation rules, and customizations, we manage pricing and minimum-stay restrictions for any portfolio size, with prices automatically uploaded to preferred channels such as Airbnb, Vrbo, and 100+ property management and channel integrations.
Every day, we price over 300,000+ listings globally across 135+ countries, offering world-class tools like the Base Price Help and Minimum Stay Recommendation Engine. Choose PriceLabs to increase revenue and streamline pricing and revenue management. Sign up for a free trial at pricelabs.co today.