
Updated: January 17, 2024
Key Takeaways
The following data from PriceLabs’ Short-term Rental Worldwide Index is for the Madrid region of Spain from January 2021 to November 2023. Average Daily Rate (ADR) and Revenue Per Available Room (RevPAR), both in Euros (€), Occupancy rates, average bookings, and count of active listings have been highlighted for each month.
- A noticeable trend throughout the data reveals that ADR and RevPAR, which denote the earning power of the vacation rental industry, have generally increased over the given period. For instance, ADR rose from 77€ in January 2021 to 130€ by October 2023, and RevPAR saw an increase from 19€ to 87€ in the same period. This points to positive growth in revenues.
- Furthermore, occupancy rates and average bookings significantly improved, indicating better utilization of short-term rental resources.
- The data also shows that the count of active listings had an upward trend, reflecting potential growth in the local market.
- Primarily, the increases in ADR and RevPAR may suggest an improvement in the economic health of Madrid’s vacation rental sector over this period.
ADR Summary
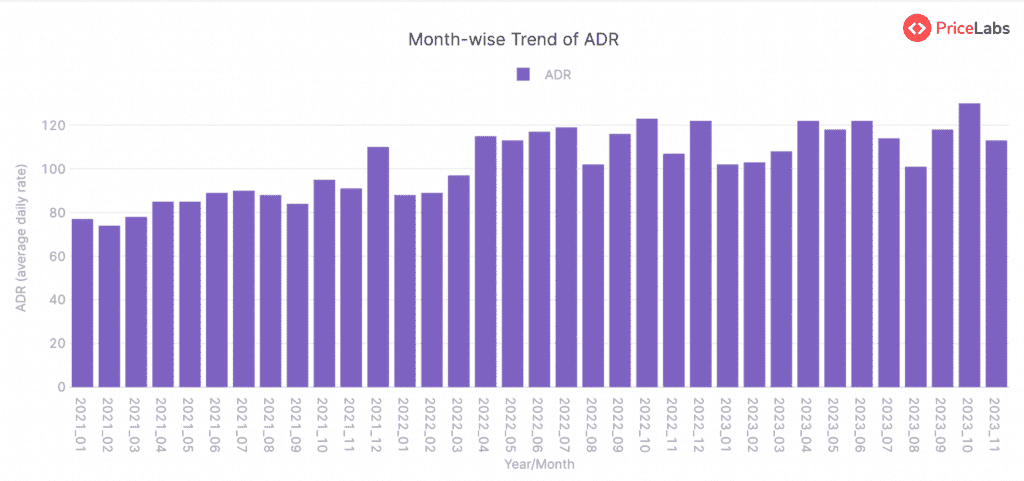
The Average Daily Rate (ADR) in Madrid, Spain, as represented in euros (€), has shown an overall increasing trend throughout the past three years, as per the provided data. Starting from €77 in January 2021, the ADR experienced slight fluctuations in the initial months but reached €85 in April and May 2021.
After a minor drop in August 2021 (€88), ADR peaked at its maximum of the year, reaching €95 in October 2021. Then, the ADR decreased slightly to stabilize at €84 in September 2021 before distinctly increasing to a record €110 in December 2021.
The upward trend continued in 2022 with few fluctuations and a notable peak in April (€115), May (€113), and June (€117). The ADR experienced a slight decrease in July and August, followed by another peak in October (€123), followed by a drop in the subsequent months, with the lowest being €102 in August. The ADR then picked again to €122 in December 2022.
In 2023, the ADR maintained the increasing momentum with several ups and downs, reaching a new high of €130 in October. The slight decline in ADR observed in July (€114) and August (€101) 2023 could represent a seasonal trend.
Overall, there is an observable seasonal pattern where ADR usually peaks around the second quarter and end of the year, potentially indicating a preference for travel during these periods in the Madrid region.
RevPAR Summary
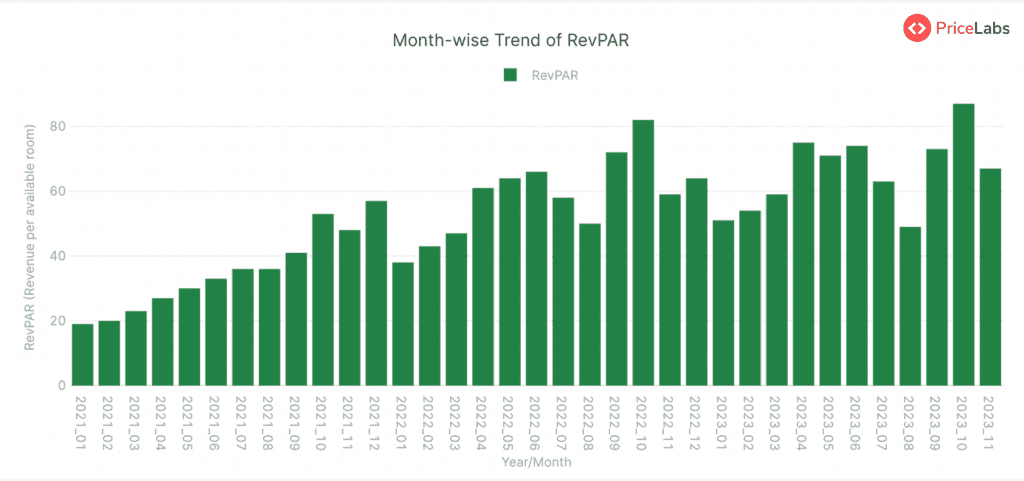
The Revenue per Available Room (RevPAR) for the Madrid region in Spain exhibited a generally increasing trend from January 2021 to October 2023. Starting from 19€ in January 2021, it remained relatively low in February and March 2021, at 20€ and 23€ respectively. RevPAR then saw a consistent increase from April 2021, hitting 30€ in May and continuing this upward trend through to September, where it reached 41€.
In October 2021, there was a significant leap to 53€, and it peaked at 57€ in December 2021 before slightly dropping to 38€ by January 2022. Despite this drop, it continued to trend upward again, reaching 66€ in June 2022, but it then experienced another decline to 50€ by August 2022.
From September 2022, RevPAR rose dramatically, hitting a high of 82€ in October 2022 before slowly descending to 51€ in January 2023. The following months witnessed another upward swing, with it reaching 75€ in April 2023. RevPar remained relatively stable above 70€ until it fell to 63€ in July 2023.
By August 2023, it descended further to 49€, marking the lowest point since February 2021. However, the figures started to climb again from September 2023, culminating in a high of 87€ in October 2023. It finally settled at 67€ in November 2023. Throughout this period, it’s also worth noting the existence of a periodic trend where RevPAR seemed to peak towards the end of the year, particularly around October and December.
Read here: How to Calculate RevPAR.
Occupancy Rate Summary
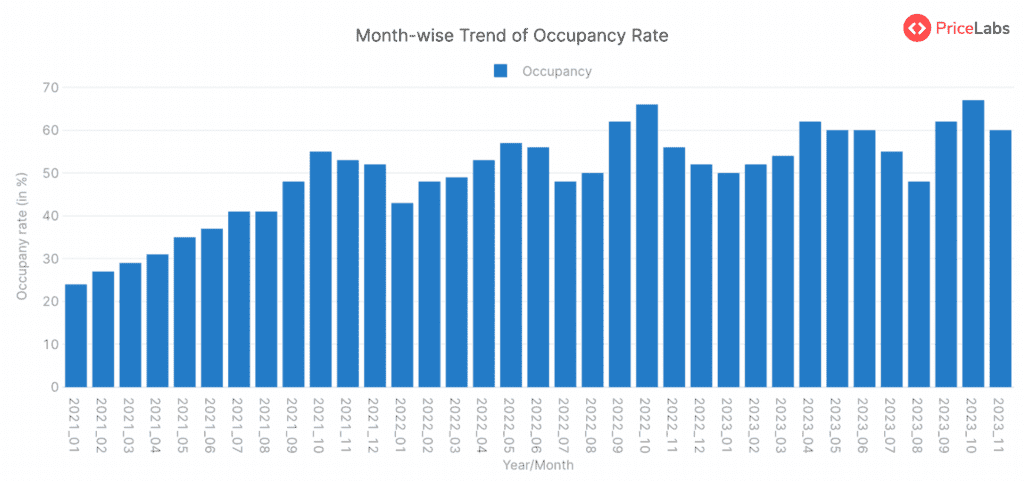
The occupancy rate trend in Madrid, Spain, typically starts at a lower point in January and gradually increases as the year progresses. In 2021, there’s a clear upward trend in occupancy, starting from 24% in January, peaking at 55% in October, and then slightly decreasing towards the end of the year. The same trend is observable in 2022, beginning with 43% occupancy in January and peaking at 66% in October. The trend continues into 2023, with occupancy kicking off at 50% in January and reaching a peak of 67% by October. It is noticeable that the fall months, particularly October, consistently represent the highest points of occupancy each year, indicating a potential seasonal preference for travel to this region during this period. However, there seems to be a general decline in occupancy rates towards the end of each year.
Read here: How to Calculate Occupancy Rate.
Avg. Bookings Summary
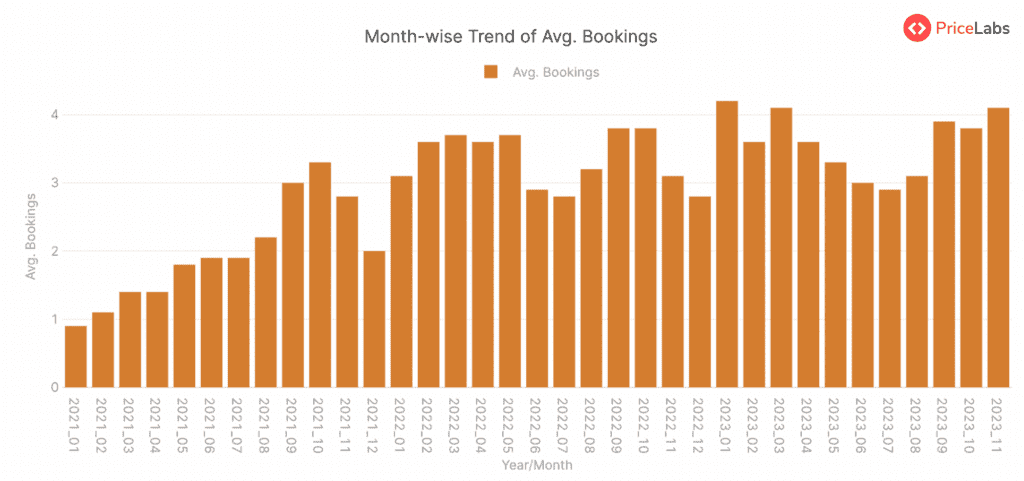
The average bookings in Madrid, Spain, showed a general upward trend from January 2021 to November 2023, though with notable periodic fluctuations.
In 2021, the average bookings started at 0.9 in January and mostly increased throughout the year, peaking at 3.3 in October. However, there was a slight dip in December to 2.0 bookings.
In 2022, the trend mostly replicated the previous year’s pattern. It started with an increase from 3.1 bookings in January to the peak of 3.8 in September and October, followed by a slight decrease towards the end of the year.
In 2023, the highest number of average bookings occurred in January, with 4.2 bookings. A similar trend from the previous years continued throughout 2023, with a gradual decrease after January, a rise peaking at 4.1 in November, and a decrease in December.
This cyclical pattern suggests potential seasonal effects on the average bookings in Madrid, with peaks usually in the autumn months (October and November) and dips towards the end of the year.
Count of Active Listings Summary
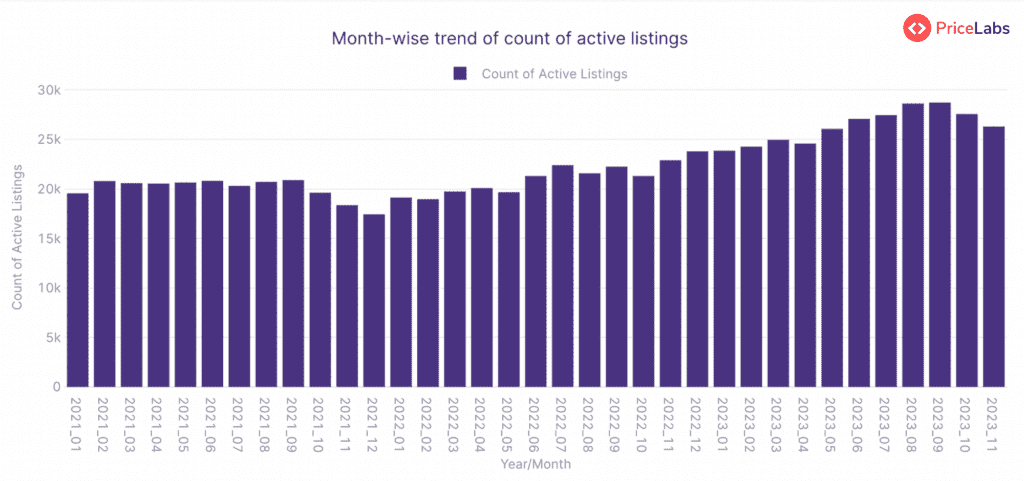
The count of active listings in Madrid, Spain, fluctuated from January 2021 to November 2023. The count started at 19,564 in January 2021 and saw a slight increase until February 2021, when it reached 20,804. The count slightly declined in the following months until July, reaching 20,317, and again picked up slowly to reach a high of 20,896 in September 2021. Thereafter, it significantly dropped to 17,438 in December 2021.
However, from January 2022, there was an upward trend with occasional drops, where it peaked at around 22,400 in July 2022. Post this, it fell to 21,317 in October 2022 and then dramatically increased in November 2022 to 22,901. By December 2022, the counts reached their all-time high of 23,803 and didn’t stop there.
The upward trend continued with a strong momentum into 2023, reaching a high of 28,633 in August 2023. It almost held the same number in September 2023 with a count of 28,730, after which there was a downturn again. By November 2023, it decreased to 26,316, which is still higher than where the count started back in 2021.
Overall, the general trend of the count of active listings in Madrid, Spain, over the stated period can be viewed as a progressive increase, despite experiencing some occasional drops.
Get actionable market insights from PriceLabs’ Market Dashboards.
About Short-term Rental Index
The World STR (Short-term Rental) Index by PriceLabs is a free tool for tracking short-term rental market performance worldwide. It offers data from Airbnb markets worldwide, refreshed monthly. You can access free insights on which locations are gaining or losing popularity. Key features include:
- Compare: Compare year-over-year metrics like active listings, occupancy rates, RevPAR, and ADR.
- Trend: Visualize how metrics have changed over the past years.
- Pacing: Compare upcoming year metrics to the previous year for occupancy, ADR, and RevPAR.
Explore more FREE tools by PriceLabs here.
About PriceLabs
PriceLabs is a revenue management solution for the short-term rental and hospitality industry, founded in 2014 and headquartered in Chicago, IL. Our platform helps individual hosts and hospitality professionals optimize their pricing and revenue management, adapting to changing market trends and occupancy levels.
With dynamic pricing, automation rules, and customizations, we manage pricing and minimum-stay restrictions for any portfolio size, with prices automatically uploaded to preferred channels such as Airbnb, Vrbo, and 100+ property management and channel integrations.
Every day, we price over 300,000+ listings globally across 135+ countries, offering world-class tools like the Base Price Help and Minimum Stay Recommendation Engine. Choose PriceLabs to increase revenue and streamline pricing and revenue management. Sign up for a free trial at pricelabs.co today.