Updated: May 24, 2024
As hosts and property managers, your goal is to set prices that get your property booked by guests while maximizing your revenue. To do that efficiently, you need essential market data and the ability to compare against your direct competitors.
This month’s updates are laser-focused on helping you analyze your true competition. We help you make more accurate price comparisons against your competitors by surfacing cleaning fees, and host fees, and allowing you to account for channel markups. Also, to manage a large portfolio, the new subgroup upgrade provides extra control. This way, you can confidently optimize pricing, save time, and maximize revenue across all your units.
Compare Prices Accurately with the Improved Competitor Calendar
A common challenge when comparing your prices to those of the competition is that the rates displayed on booking platforms like Airbnb often differ from what you see on PriceLabs. This discrepancy occurs because fees and markups can be added on top of the nightly rates generated by PriceLabs.
The pain of comparing nightly rates and total stay prices
When you compare the nightly rate generated by PriceLabs with the rates of your competitors, you need this extra information to make a more accurate decision. When a graph shows competitor prices, the question on your mind could be: Is it just their nightly rate? Does it include their cleaning fees or markup for this channel?
For instance, cleaning fees can vary from $0 to hundreds of dollars. The host service fee on Airbnb is not the same whether the host is under the spit-fee model (a 3% host fee) or the host-only fee model (a 15% host fee). As you can see, whether these fees are included when your rates are compared to the rest of the market is very important.
Similarly, some property managers apply a markup on booking channels to offset the fees or commissions charged by these channels. For example, they might add a 15% markup to their prices on Booking.com and an 8% markup on Vrbo. This results in different final prices on various platforms. If you plan to add such markups, you will want to understand how they will impact your nightly rates compared to other prices in the market.
How PriceLabs’ improved Competitor Calendar solves this issue
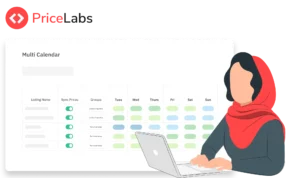
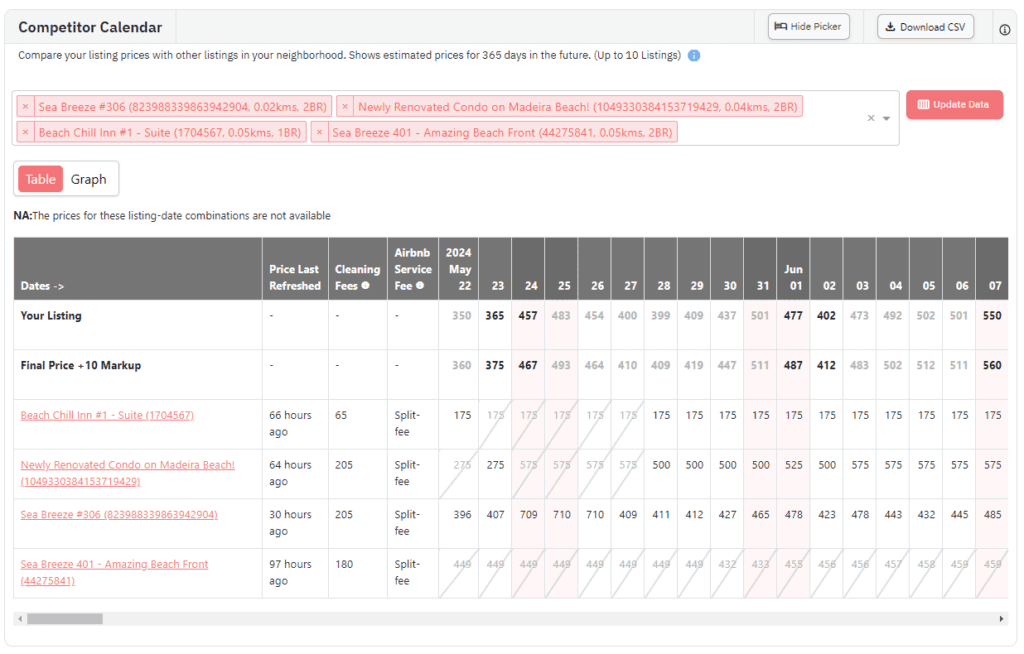
With our Competitor Calendar feature, located in the Neighborhood Dashboard, you can compare your prices with up to 10 similar listings of your choice. We use publicly available data to create these comparisons.
To compare apples to apples, you need a breakdown of the final prices and the ability to add markup to your nightly prices. We have introduced these features in the Competitor Calendar to help our users compare prices more accurately.
- Airbnb Cleaning Fees
You can now see the cleaning fees charged by your selected competitors in a new column. This fee is listed separately from the nightly rate. - Airbnb Service Fee Models
Airbnb has two different service fee structures for hosts: a Split fee and a Host-only fee. This new column shows which hosting model each competitor property follows. - Ability to Add Markups (or markdowns)
Now you can add a markup (or markdown) of your choice, enabling you to see how your final nightly prices compare with your competitors. This way, you can simulate different scenarios and see in which percentile your nightly rate plus markup will fall.
Note that the markup feature is also available in the Future Prices chart, also located in the Neighborhood Data tab.
Here’s how to view Airbnb Cleaning Fees & Service Models
Here’s how to add markups or markdowns
Compare Your Property Prices Against Properties Already Booked In The Market
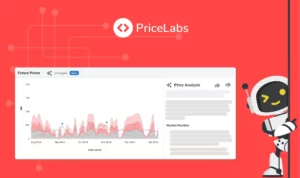
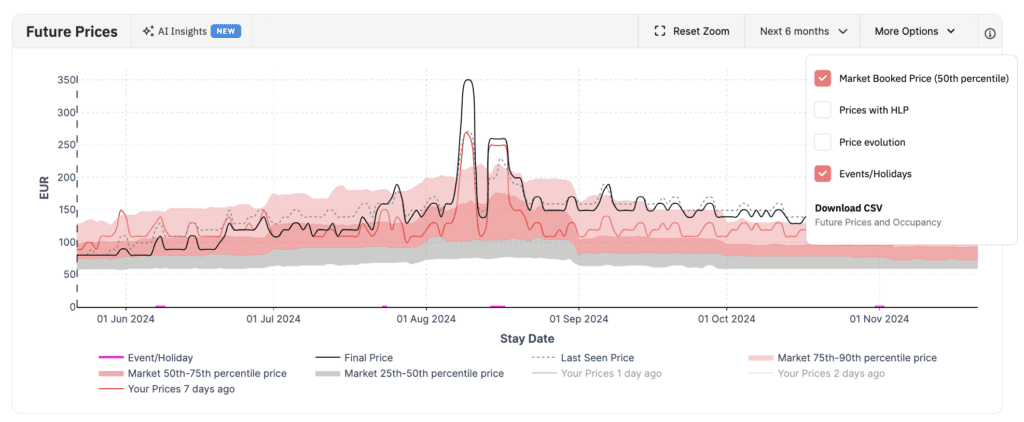
The Future Prices chart now also displays the Market Booked Price, which is the median price at which properties are being booked. It is calculated using publicly available data – we are not sharing any data from customers.
Previously, the chart only showed the prices at which listings in the market were listed. You can see them in the chart, represented by the gray and pink bands, which already bring you important market information.
Now, these bands indicate the listed prices in the market, while the Market Booked Price shows the prices at which bookings are actually being made.
This helps you determine if your prices are too low or too high compared to the market. Property managers can use this information to show homeowners the prices at which bookings are happening and make necessary adjustments.
Click to learn more about Market Booked Price
Granular Pricing Control, Made Easy with Subgroups
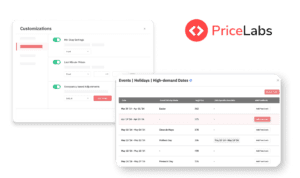
Many large property managers use PriceLabs to save time and simplify the process of pricing their large property portfolios. With our tool, they can create Groups and Subgroups of properties and apply different settings to each.
With the Groups feature, you can categorize similar listings together. For example, create separate groups for 1, 2, 3, or 4+ bedroom listings. Once created, you can apply the same customizations, pricing strategies, and date-specific overrides to an entire Group. This eases your workflow and ensures consistent pricing across similar listings. Groups are available to all PriceLabs users, while Subgroups are available upon request.
Subgroup is an advanced feature that provides extra control. For example, you might have Groups for listings in “Neighborhood A” and “Neighborhood B” with different last-minute discounts. If you want different minimum stays for 2-bedroom listings in both neighborhoods, create a “2BR” Group. Use it as a Subgroup to apply the same settings easily across “Neighborhood A” and “Neighborhood B, saving time and effort.
In this update, we have streamlined the process of assigning Subgroups to properties and show the occupancy metrics for Subgroups available in the Group calendar. Similar to assigning properties to a group, the process is straightforward:
- Navigate to the Manage Listings page
- Select the listings you want to assign a Subgroup to by checking the corresponding boxes
- In the bulk action bar that appears, choose the “Assign Group/Subgroup” option
- Select the desired Subgroup from the dropdown menu
- Review the selected listings and the chosen Subgroup
- Click on Update
Viewing Group & Subgroup occupancy
- Navigate to the Customizations page
- Select Groups
- Navigate to your preferred Group and click on Group Calendar
- Hover over any date to view the Occupancy details at the Group and Subgroup level
Upgraded Filters for Accurate Comparison in the Market Dashboard
PriceLabs’ Market Dashboards help you understand market trends, create competitor sets, and identify investment opportunities. You can create customized comparable property sets (“CompSets) and filter them to focus on the right competitors. In this update, we are adding more criteria to refine the comp set you want to compare against. These three new filter types can help you focus on similar properties based on their location, amenities, and cancellation policies:
- Radius from the property: Select how far properties in the CompSet are located from your location
- Cancellation Policies: Select Airbnb properties with similar cancellation policies as yours
- Amenities: New amenities – Sauna, BBQ Grill, Ski In & Ski Out – are added to the existing list to filter for properties offering the same conveniences to their guests.