

In this blog update, our PriceLabs team introduces three new features designed specifically for large property management companies. These tools are crafted to enhance efficiency and streamline management processes of revenue management teams managing property portfolios of 100 listings or more.
Control customizations seasonally with new Pricing Profiles
A Pricing Profile is a powerful tool tailored for large property management companies. It is designed for advanced revenue management teams that require more control, operate in highly seasonal markets, and manage frequent pricing & restriction adjustments. This innovative feature offers increased control, flexibility, and automation in managing seasonal pricing and restrictions.
Please note: 99% of PriceLabs users do not need Pricing Profiles. Our Hyper Local Pulse (HLP) algorithm automatically adjusts prices according to seasonal trends. It adapts to local markets and each listing’s performance. In most cases, Smart Presets are better suited to users’ needs. They offer effective pricing customizations without complexity or risk.
Pricing Profiles enable revenue managers to further tailor our HLP algorithm to their needs
Pricing Profiles offer significant benefits to revenue managers. They grant enhanced control and customization over pricing strategies. This goes beyond what the advanced HLP algorithm automatically provides. The HLP algorithm excels in adapting to local market conditions and individual listing performance. However, Pricing Profiles allow for tailored adjustments that cater to the unique demands of different seasons and specific market trends if your operational needs or portfolio are different from the broader market.
Pricing Profiles can create advanced seasonal pricing strategies.
Revenue managers can implement refined strategies using Pricing Profiles. Here are four examples:
Example 1: Orphan Day Pricing Adjustments:
- Strategy for High Season: Opt for a modest orphan day discount, around 10%, due to the higher likelihood of securing bookings during peak seasons.
- Strategy for Low Season: Increase the orphan day discount to 20-30%, recognizing that attracting bookings may be more challenging in off-peak periods.
Example 2: Flexibility in Demand Factor Sensitivity:
- Low-Season Approach: For periods characterized by longer-term, monthly bookings, such as the low season, reduce the sensitivity of the Demand Factor within our dynamic pricing algorithm. This adjustment ensures more stable and predictable pricing.
- Peak vs. Off-Peak Strategies: Customize the algorithm’s aggressiveness based on the season, either amplifying or toning down the reactivity to market changes during peak or off-peak times, respectively.
Example 3: Adaptive Last Minute Pricing:
- High Season Policy: Implement minimal or zero discounts for last-minute bookings during high-demand periods, capitalizing on the high probability of securing bookings even without significant price reductions.
Example 4: Seasonally Adjusted Occupancy-Based Pricing:
- Customized by Season: Develop distinct profiles for occupancy-based pricing adjustments that align with the unique booking windows and demand patterns of each season, allowing for more effective and responsive pricing strategies
How Pricing Profiles complement Season Profiles and Min-Stay Profiles
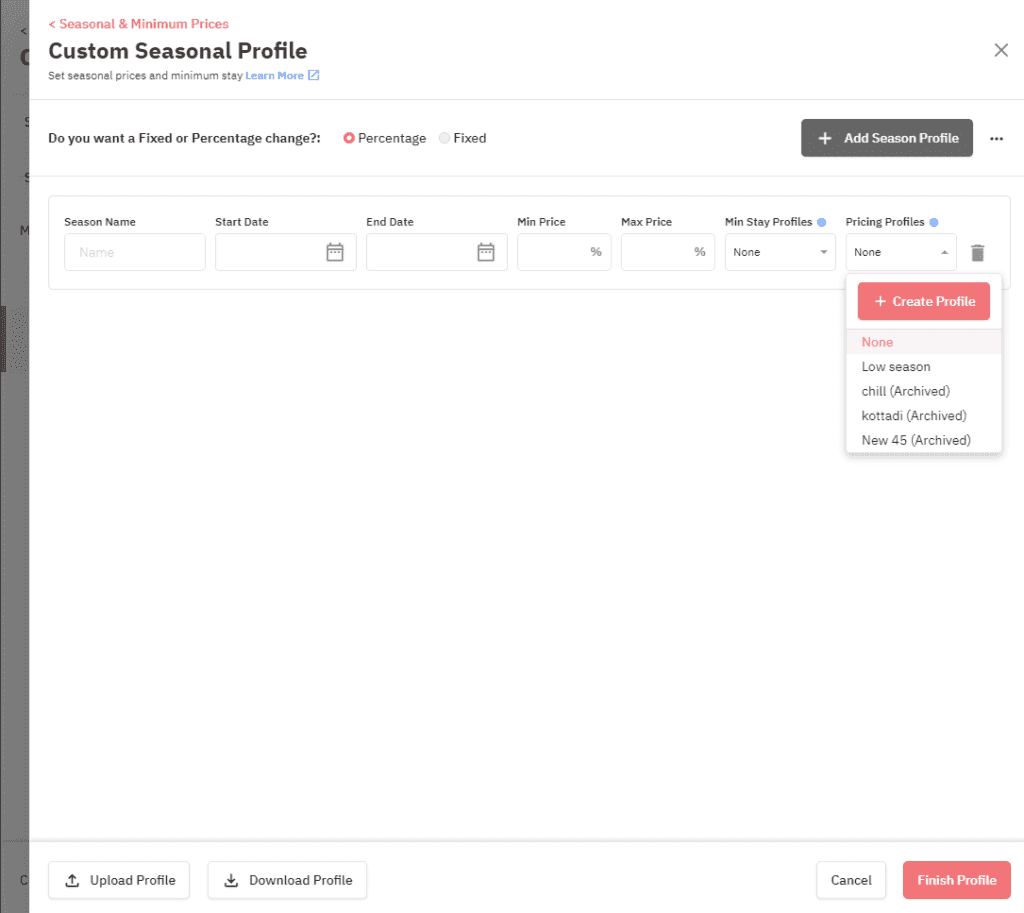
A Custom Seasonal Profile bundles your price and minimum stay rules. You can save and use it across your listings. It’s a smart way to maintain control and save time. You can apply similar rules to multiple properties.
We’ve already included a Min-stay Profile feature in the Custom Seasonal Profile. It simplifies setting up minimum-stay customizations for each of your listings.
Enter Pricing Profiles. As explained previously, this new feature enables revenue managers to easily tie pricing modifications to various seasons. It allows them to get even more control over our pricing algorithm.
For each Custom Seasonal Profile, you can choose to have a Min-Stay Profile, a Pricing Profile, or both, depending on your goals.
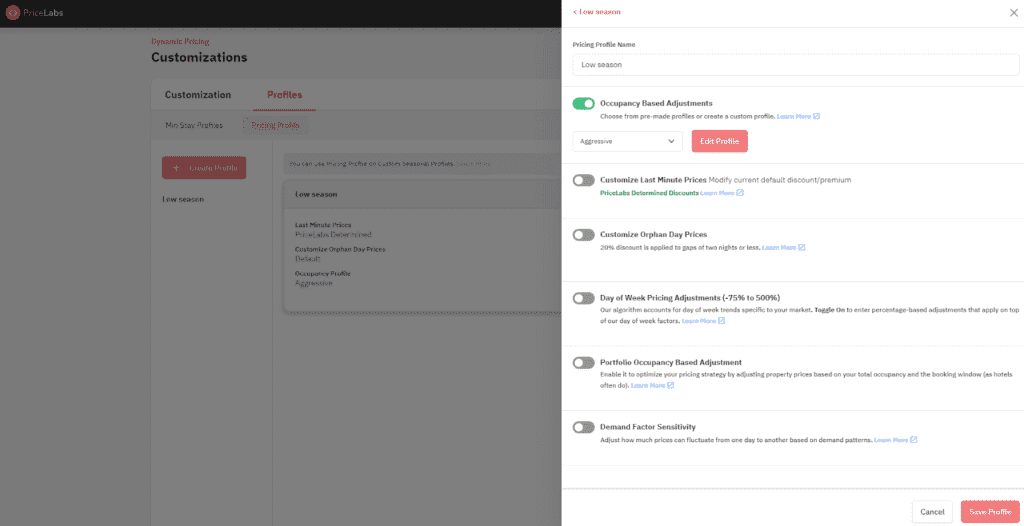
How to create a Pricing Profile
To set up a new Pricing Profile, go to the Customizations page. Click on the Pricing Profiles tab under Profiles. Here, you can pick from a range of pricing customizations based on your requirements.

Once set up, you can apply these Pricing Profiles to individual listings, groups, or across your entire account in the Custom Seasonal Profile tab.

More granular team management with new access permissions
In revenue management, structured team access and permissions are crucial. This is especially true when many team members access the same account. Implementing varied access levels is essential. This also promotes transparency and accountability through logged actions. PriceLabs has introduced new additions to its Team Management Settings to include Mapping and Team Settings Permission.
Mapping Permission
The new Mapping Permission lets you control which team members can map listings. However, these users will need access to all Listings.
To learn more about mapping, click here.
Team Settings Permission
With the Team Settings permission, account admins can now delegate and share the task of managing team settings with another team member.
To grant this permission, follow these steps: Go to Settings -> Team Settings, locate the ‘Edit permissions’ menu for the desired team member, and change their Team Settings from ‘No Access’ to ‘Access’. Once granted, they will have full access to the team settings page within your account.
Only company domains can be granted Team Access; public domains such as @gmail.com or @yahoo.com are not eligible for the Teams feature.
Showing when bookings were made in Neighborhood Data
We’ve added the date when each of your bookings was made to our Future Prices chart. You can see the booking date in the tooltip when you hover over a specific booking. Let’s see how you can use them to understand why booking rates differ from one year to another.

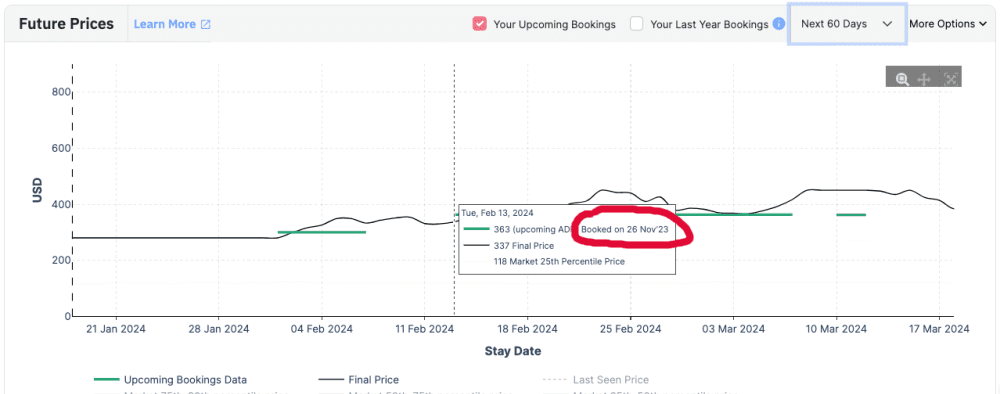
Our Neighborhood Data tab offers a wealth of information about your market and competitors. A central feature of this tab is the Future Prices chart. It graphically presents how your suggested prices compare to average market prices. This chart includes both Last Year’s and Upcoming bookings.
We’ve enhanced this graph by including when these bookings were made. This provides valuable insights into lead times. Lead time, or booking window, is the time between a reservation’s booking and the actual stay.
Seeing when bookings are made sheds light on why PriceLabs may recommend different prices from what you charged in the previous year. When you spot a price change from one year to the next, you might ask, “Why the difference?” This is where the concept of lead time is vital.
For example, let’s say that last year, for specific dates, you secured a booking 8 months in advance. This year, the same dates are still open with just 2 months left. Consequently, PriceLabs lowers the suggested rates. The decrease in price is linked to the shorter lead time, as the dates haven’t been booked yet. Unlike the previous year, when it was booked well ahead.
Having under your eyes the date when a booking was made helps you better explain changes in the rates we recommend. It helps you better understand current booking trends for a specific property.