
Updated: June 20, 2023
Hello readers!
My name is Joana Coelho, and before starting my journey as a Solution Consultant at PriceLabs, I worked as a Revenue Manager for about 9 years with large hotel chains and as a consultant for smaller boutique hotels and aparthotels handling their revenue management strategy.
As Revenue Manager/Property Manager, we all see numbers on a day-to-day basis. However, are we aware of how we helped improve the performance? And are we achieving better results in a timely manner?
At PriceLabs, we are committed to providing our users with a focus on the strategic side of their business. We provide cutting-edge tools needed: automated pricing, minimum stay restrictions, and extensive and intuitive reporting tools that are just a click away.
Changes to the Portfolio Analytics tool covering Pacing and Booking Curves
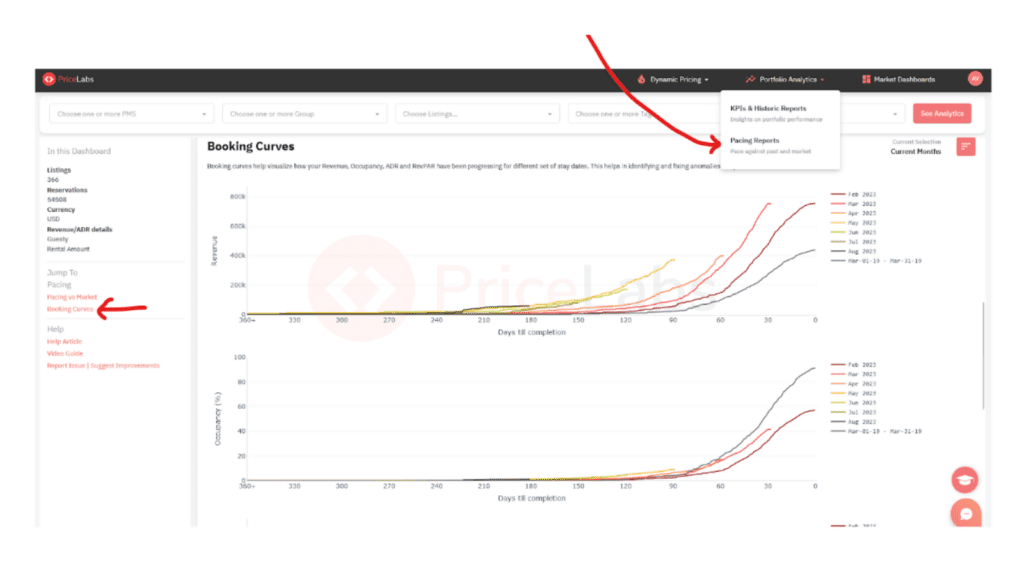
Recently, we made significant updates to our Portfolio Analytics product. A key change we made is splitting Portfolio Analytics into two sections – Pacing & KPIs and Historical Reporting. This allows us to focus more on backward-looking analysis in the Historic Reporting section and forward-looking analysis in the Pacing section.
Before diving into the booking curve section, let’s quickly look at pacing. Pacing compares current booking activity to past performance or a defined benchmark.
Pacing against the market to optimize rates and maximize revenue
This is the first section of the Pacing tool. It shows how the current state of a property compares to what was happening at the same time last year. For example, if you are looking at your bookings for the month of May, the Pacing Against Market section will show you how your bookings for this May compare to your bookings for May of last year and help you create relevant strategies as a Revenue Manager.
Booking curves to help you understand the build-up of key metrics
In all the diverse roles and products I’ve managed before, one thing is common – Booking Curves have been at the essence of revenue management strategic decisions.
The second section of the Pacing tool is the Booking Curve section. This section is an evolution-focused tool. It helps revenue/property managers see how specific changes they made might have impacted bookings. You can also see how a few changes might not have been in your control. Analyzing how pricing and marketing strategies impact bookings over time can be incredibly useful.
With Booking Curves, we can easily see how bookings, revenue, and ADR behave compared to previous years. You can see the evolution of KPIs up until now and analyze performance. With this, you can also see actionable insights to drive revenue management and pricing strategy changes.
Is your booking curve performing better for a certain period? When did the performance become better? What did you do that triggered this? You can get these answered using the Booking Curve report – you can easily spot the results of an action (eg., a limited-time promotion) and make better decisions for the future!
The default view of Booking Curves
The default view of the Booking Curve section shows how the revenue, occupancy, ADR (Average Daily Rate), and RevPAR have been building up for upcoming months.
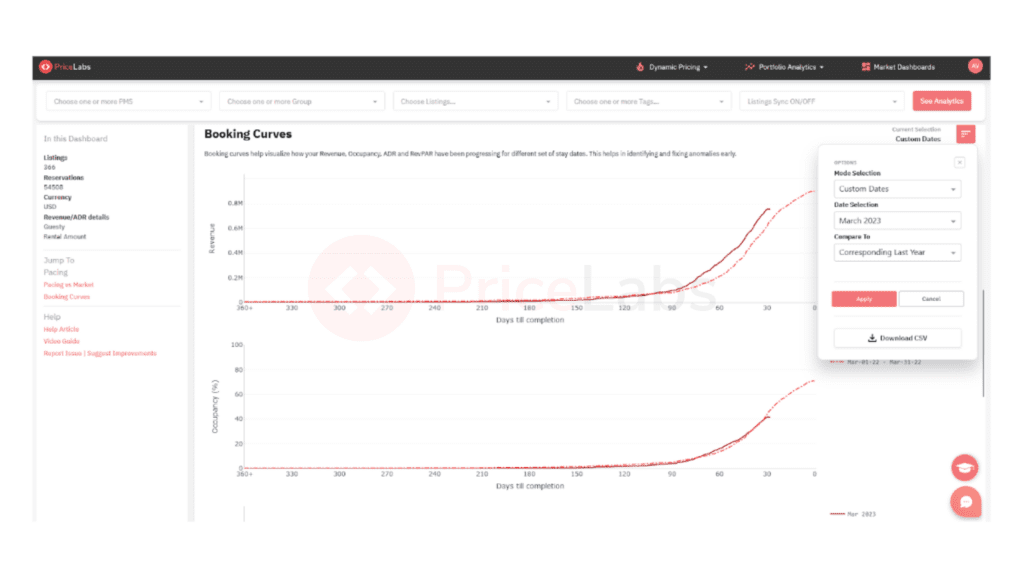
Custom date range to compare past and current bookings
If you want to do a year-over-year (YOY) analysis, choose the custom dates option from the menu. This allows you to compare your current bookings to the same period from the previous year.
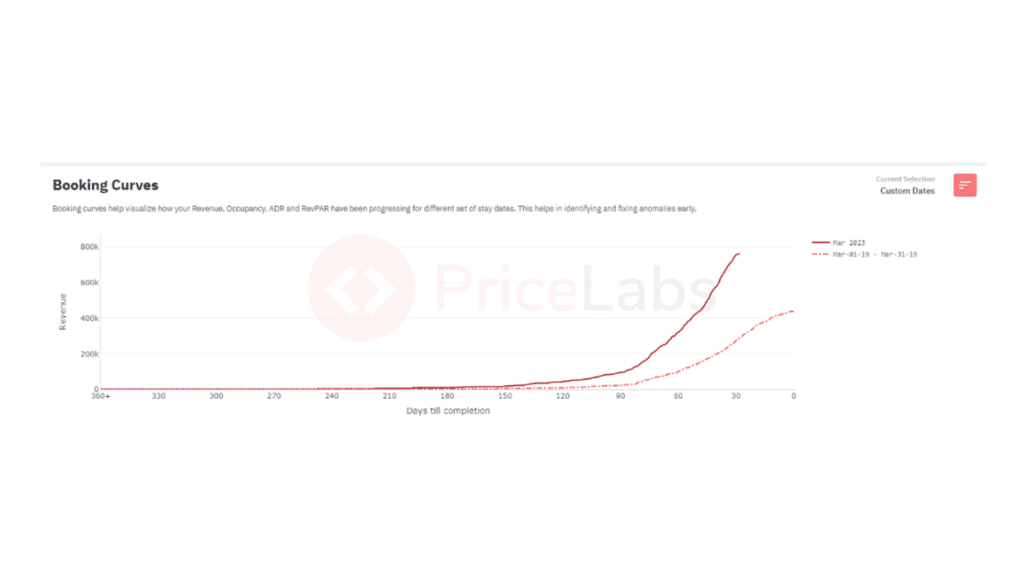
Charts with 2019 data
In response to customer requests, we’ve added 2019 data to our charts; these were limited to the current and past three years previously. This is particularly important and useful because the pandemic impacted the years after 2019.
Please Note: PriceLabs pulls this data from your PMS (property management system) or channel manager.
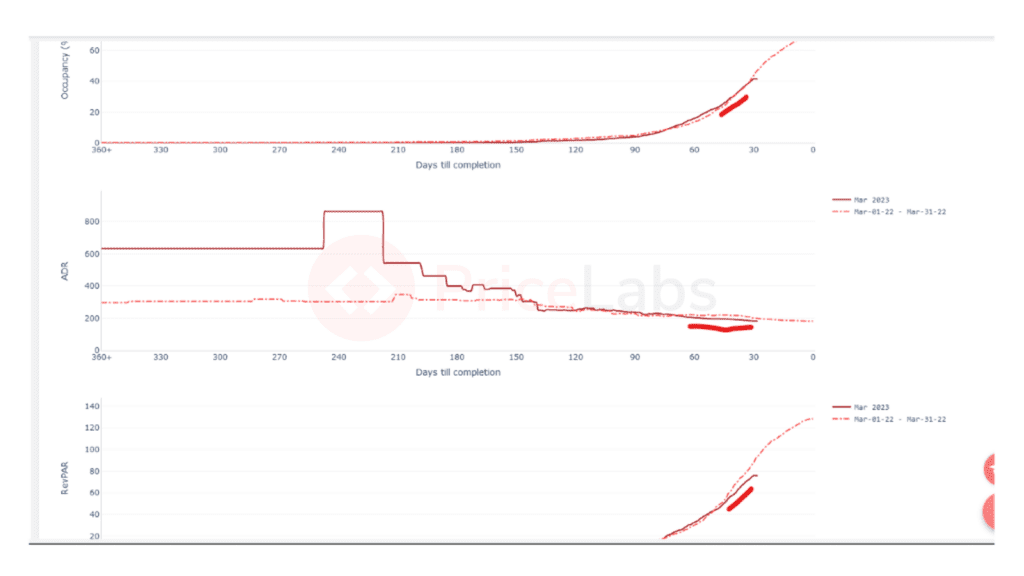
RevPAR, occupancy, and ADR
The booking curve section shows the evolution of RevPAR, occupancy, and ADR over time. These are the best KPIs to track on our curves, showing where we must re-adjust the strategy.
Should we focus more on ADR or occupancy on a certain month to ensure we reach optimal RevPAR performance? For example, if both occupancy and ADR lines are slowing down, it could indicate that the market is stable and that pricing might be adjusted to attract more guests. If both occupancy and ADR lines are increasing, it could indicate that the market is strong and there is room for growth by increasing pricing.
Creating a simple report to showcase all KPIs in an easy-to-consume format is easy. You might want to contrast your data with the market trends, do that easily with Market Dashboard, and get the latest market insights.
We hope you, a revenue manager/property manager, find this article helpful for the listings you manage and utilize our dynamic pricing and revenue management platform to unlock your revenue strategy potential.
Conclusion
PriceLabs is a revenue management solution for the vacation and short-term rental industry that combines human control with the best-in-class algorithm, market data, and customizability to maximize revenue. This helps property owners, property managers, and revenue managers increase revenue and save hours in the process.
The team is the unique sauce. They have several years of experience in revenue management, travel distribution, technology, and analytics. They have put all that experience into making a leading revenue management solution for the vacation and short-term rental industry. Founded in 2014, PriceLabs has priced over 200,000 units in 100+ countries globally.
Want to know how you can increase revenue and optimize occupancy for your properties? Ask one of our Solution Consultants for a free demo today.