


Key Takeaways
The data sourced from PriceLabs’ World STR Index encompasses the period from January 2021 to January 2024, providing insights into the performance of the Polish hospitality and rental market industry. Considering that the null state/region indicates the country level, these figures represent Poland as a whole.
- Over time, there has been a consistent rise in the Average Daily Rate (ADR) and Revenue Per Available Room (RevPAR), which are crucial profitability indicators. The highest ADR was recorded in July 2022 at PLN 654, while the maximum RevPAR was observed in August 2022 at PLN 406.
- The occupancy rate, an indicator of demand, also trended upwards, peaking at 64% in August 2022.
- From an average bookings viewpoint, the numbers seem to correlate with the occupancy rate, reaching the highest of 3.3 bookings in July for the years 2021 and 2022, and a comparable 3.3 also appearing in July 2023.
- The number of active listings has also steadily increased over time, indicating the industry’s growth.
- This data points towards improved performance and growth in Poland’s hospitality industry over these years.
ADR Summary

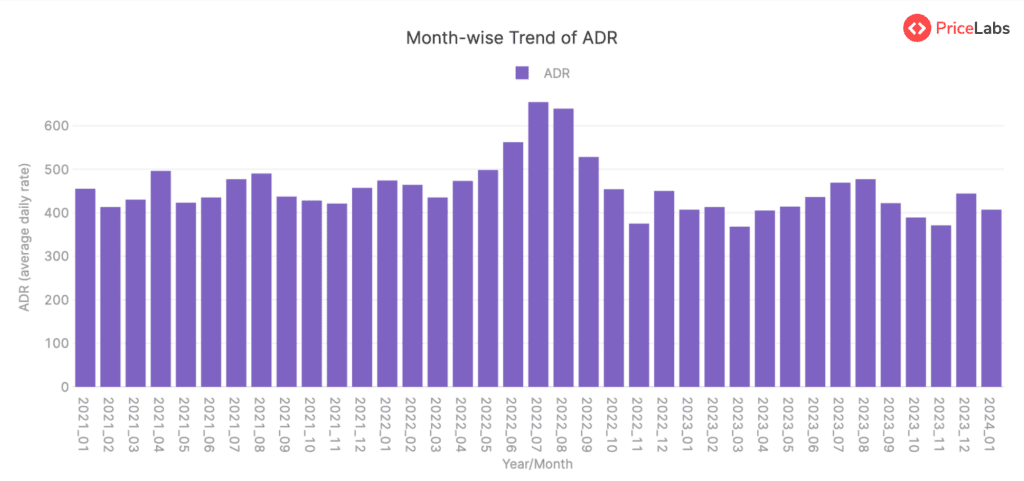
The data provided represents the average daily rate (ADR) for accommodations in Poland from January 2021 to January 2024. Overall, the ADR fluctuated over this period, indicating a possible seasonal trend in the rental market.
In the year 2021, the ADR started at PLN 455 in January, decreased to PLN 413 in February, and then fluctuated over the following months, reaching a high of PLN 496 in April and a low of PLN 413 in February. From there, the ADR increased and reached its peak for the year in August at PLN 490 before starting to decline again till the end of the year.
In 2022, the ADR started at PLN 474 in January and fluctuated throughout the year, reaching the highest value of PLN 654 in July, significantly higher than the previous year’s maximum value. Thereafter, the ADR displayed a declining trend, with a significant drop to PLN 375 in November before ending the year at PLN 450.
In 2023, the ADR trend was similar to previous years, with fluctuations throughout the year. It started at PLN 407 and peaked at PLN 477 in August before decreasing for the rest of the year.
The ADR was recorded at PLN 407 in January 2024, which is less than the ADR recorded for January 2023.
Overall, the ADR tends to peak in the middle of the year, around the summer season, and is lower at the beginning and end of the year. This suggests a possible seasonal effect on the average daily rate in Poland.
RevPAR Summary
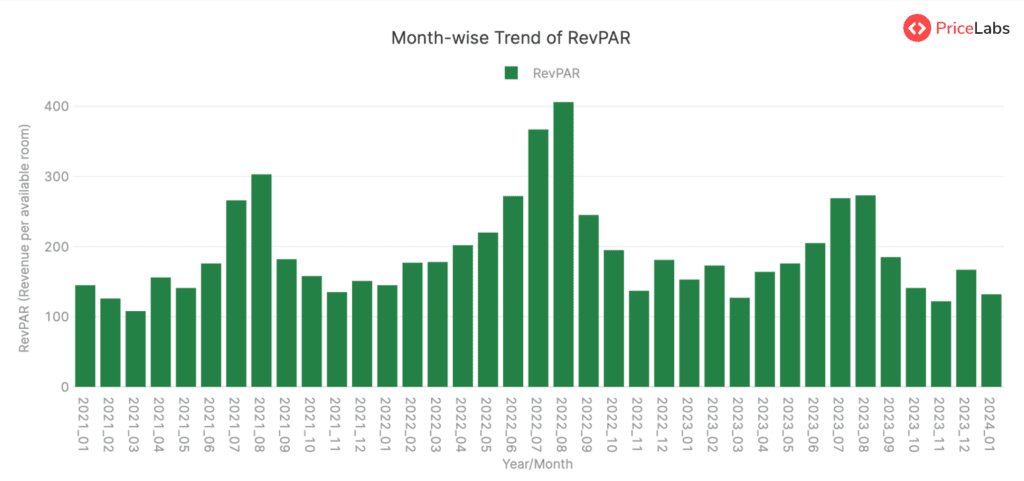
The Revenue per Available Room (RevPAR) for the entire country of Poland showed a consistent trend from January 2021 to January 2024. The data starts in January 2021 with a RevPAR of PLN 145. It registered slight decreases in February and March but then started an upward trend from April onwards, peaking in August 2021 at PLN 303. This suggests a seasonal trend where the summer months (June – August) have a higher RevPAR, likely due to increased tourism.
After the peak in August, the RevPAR started to decline but remained relatively consistent through the end of the year, bottoming out at PLN 135 in November. This pattern seems to repeat in the second year, with a similar upward trend from January through to a peak in August 2022 (PLN 406), before dropping again towards the end of the year.
The same periodic trend was observed in 2023 when RevPAR hit its peak (PLN 273) again in August before falling towards the end of the year. However, RevPAR in 2023 was generally lower than in the previous two years.
In summary, there appears to be a clear seasonal pattern in RevPAR for Poland, with peaks during the summer months and troughs during the colder weather. The highest RevPAR was recorded in August of each year from 2021 to 2023. The data also shows that the RevPAR has slightly decreased over the observed period, displaying the dynamic nature of the short-term rental market.
Read here: How to Calculate RevPAR.
Occupancy Rate Summary
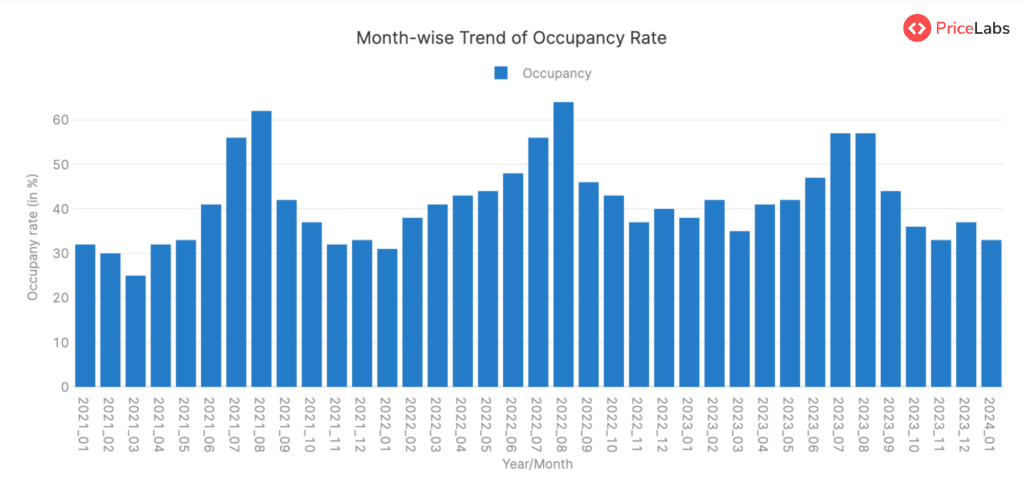
The occupancy rate in Poland showed a general trend of increasing from January 2021 to August 2021, starting from 32% and reaching a peak of 62%. Following this, there was a dip in September 2021, with occupancy falling to 42%, but it again gradually increased, reaching another peak in August 2022 at 64%. The months following August 2022 witnessed a decline in occupancy rates, with the lowest of 37% in November 2022. In 2023, the occupancy rates generally showed an upward trend starting from 38% in January, reaching a peak of 57% in July and August, before it started to decline again to reach 33% in January 2024.
These trends suggest a seasonality in the occupancy rates, with the highest rates generally seen in the summer months (July and August), followed by a decrease towards the end of the year. The start of the new year then sees a gradual increase in occupancy rates, peaking again in the summer. This could be due to increased tourism and travel activity in the country during the summer months.
Overall, over these three years, there has been a slight increase in the occupancy rate, showing some growth in rental market lodgings in Poland.
Read here: How to Calculate Occupancy Rate.
Avg. Bookings Summary
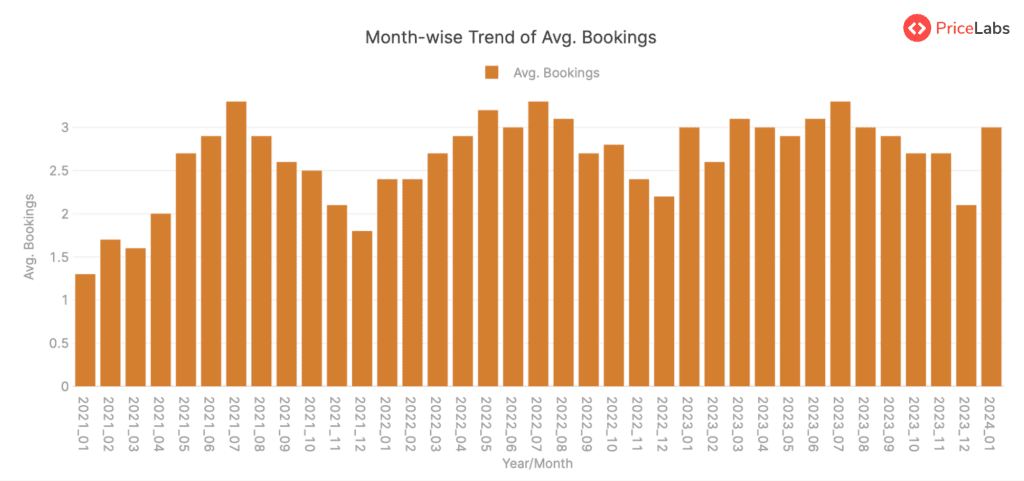
The average bookings in Poland have experienced few fluctuations but overall, shown an increasing trend from January 2021 to January 2024. At the beginning of January 2021, average bookings were relatively low at 1.3 but slowly increased and peaked at 3.3 in July 2021. However, a slight decrease in bookings was observed in August 2021 back to 2.9, which again increased to reach a maximum average booking value for the year 2021 at 3.3 in July.
Moving into 2022, we notice a more stabilized pattern, with average bookings fluctuating between 2.4 and 3.3 throughout the year. However, a noticeable monthly trend can be observed: bookings peak in the summer middle months (July stands at 3.3) and experience a slight decline towards the end of the year and the start of the next year.
In 2023, the average bookings fluctuated between 2.6 and 3.3, with the peak in summer around July and August, with a value of 3.3 and a touch lower than 3.0, respectively. The trend of a minor decline in bookings towards the end and start of the year remains consistent.
In the last available month of data, January 2024, the average booking was at a higher level than it was three years ago, at 3.0, up from 1.3 in 2021.
In conclusion, over the years, average bookings have experienced a relatively steady increase with a recurrent pattern of high bookings during the middle of the year, essentially in the summer months., followed by a slight decrease in the numbers as the year progresses towards its end and in the early months of the next year.
Count of Active Listings Summary
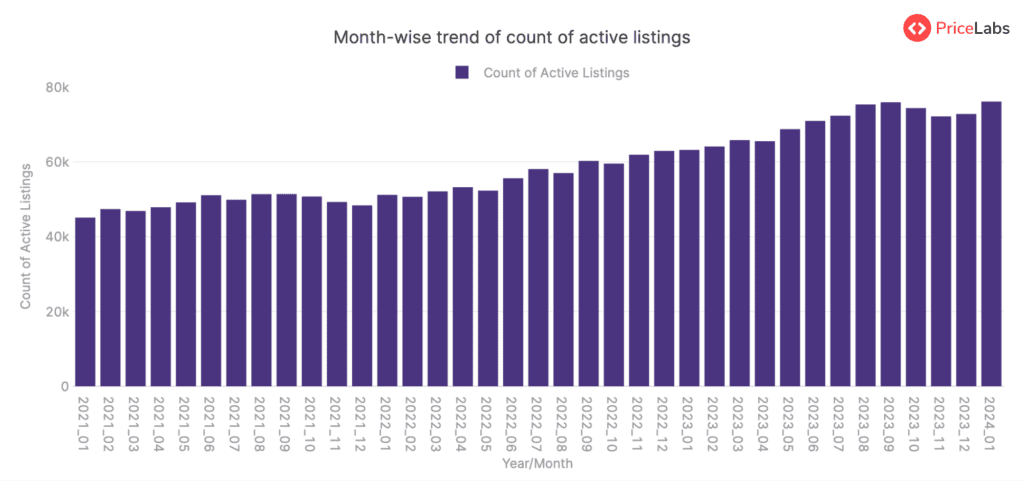
The count of active listings in Poland has shown a consistent upward trend over the observed period from January 2021 to January 2024, showing growth in the rental market space. In January 2021, the count was 45,095, and it expanded to 76,093 by January 2024, implying an increase in active listings over these three years. Some fluctuations in the count can be noticed during these years. Still, the overall trend has been upward, indicating a growth in the number of people listing their properties over the given timeframe.
Get actionable market insights from PriceLabs’ Market Dashboards.
About Short-term Rental Index
The World STR (Short-term Rental) Index by PriceLabs is a free tool for tracking short-term rental market performance worldwide. It offers data from Airbnb markets worldwide, refreshed monthly. You can access free insights on which locations are gaining or losing popularity. Key features include:
- Compare: Compare year-over-year metrics like active listings, occupancy rates, RevPAR, and ADR.
- Trend: Visualize how metrics have changed over the past years.
- Pacing: Compare upcoming year metrics to the previous year for occupancy, ADR, and RevPAR.
Explore more FREE tools by PriceLabs here.
About PriceLabs
PriceLabs is a revenue management solution for the short-term rental and hospitality industry, founded in 2014 and headquartered in Chicago, IL. Our platform helps individual hosts and hospitality professionals optimize their pricing and revenue management, adapting to changing market trends and occupancy levels.
With dynamic pricing, automation rules, and customizations, we manage pricing and minimum-stay restrictions for any portfolio size, with prices automatically uploaded to preferred channels such as Airbnb, Vrbo, and 100+ property management and channel integrations.
Every day, we price over 300,000+ listings globally across 135+ countries, offering world-class tools like the Base Price Help and Minimum Stay Recommendation Engine. Choose PriceLabs to increase revenue and streamline pricing and revenue management. Sign up for a free trial at pricelabs.co today.