


Key Takeaways
The World STR Index data provides insights into the hospitality industry’s monthly rental market performance in Provence-Alpes-Cote d’Azur, France, from January 2021 to January 2024.
- Over these years, both the Average Daily Rate (ADR) and Revenue per Available Room (RevPAR) saw a general increase. The ADR peaked at 210€ in December 2023, while the RevPAR peaked at 141€ in August 2022.
- The occupancy rate peaked in the summer months, reaching up to 74% in August 2022 and 2023.
- The average monthly bookings varied, with the highest average of 3 recorded in May 2021.
- The count of active listings also increased over the period, peaking at 148,571 in September 2023.
- The data also shows that peak seasons in this region are during the summer (June – August), where the ADR, RevPAR, and occupancy rates are highest. The lowest occupancy rates are seen in winter (January – March). The increase in active listings over the years suggests a growing hospitality industry in the region.
ADR Summary

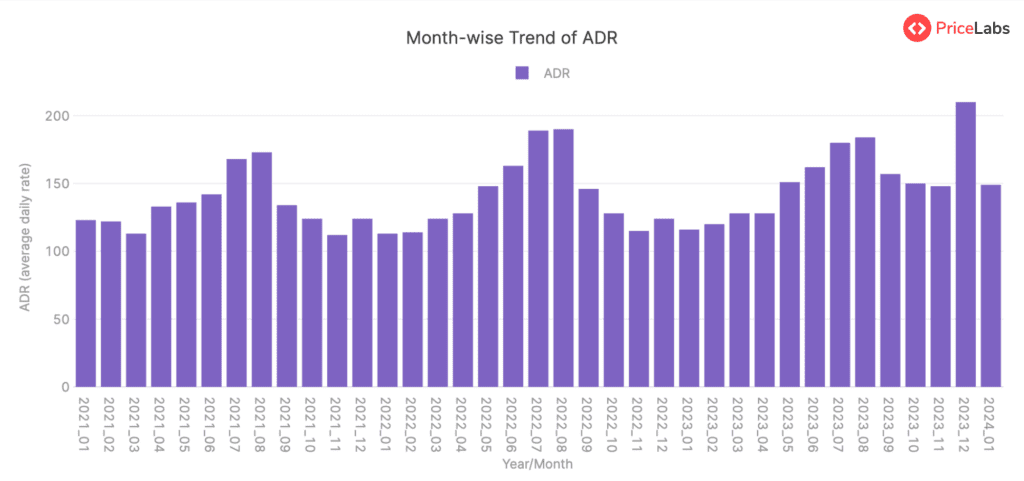
The Average Daily Rate (ADR) for the Provence-Alpes-Cote d’Azur region of France has demonstrated a fluctuating trend across the period from January 2021 to January 2024. Still, overall it has shown a positive progression.
In 2021, there was a steady increase in ADR from 123€ in January to 173€ in August, marking a high peak. However, a subsequent decline was noted in September to 134€, followed by a lower peak of 168€ in July. The ADR then decreased continually, reaching the lowest point in November at 112€, rebounding slightly to 124€ in December.
Conversely, in 2022, the ADR started at a relatively lower 113€ in January, peaking once more at 190€ in August. Similar to the previous year, a decline was witnessed post this peak, with ADR going down to 124€ in December.
The year 2023 began with an ADR of 116€ in January, which reached a high mark of 184€ in August, showing a similar peak as the last two years. However, unlike previous years, the ADR then increased to reach the highest point at 210€ in December.
Finally, in January 2024, the ADR of 149€ shows a decrease compared to the previous month but is higher than the ADR in January 2023.
This data suggests a cyclical pattern where the ADR increases from the beginning of the year and reaches a high in August, followed by a decrease in subsequent months, indicating dynamic short-term rental market performance.
RevPAR Summary
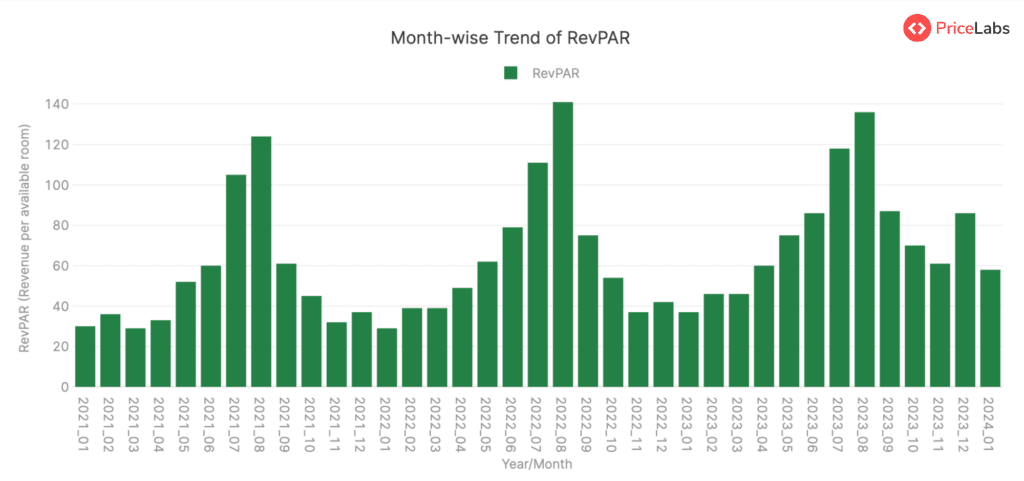
The data for the Provence-Alpes-Cote d’Azur region of France from January 2021 to January 2024 indicates a general upward trend in RevPAR (Revenue Per Available Room) measured in Euro (€). This trend, however, also displays clear seasonality, with peaks and troughs corresponding to particular months each year, demonstrating robust rental market performance.
In 2021, the RevPAR started relatively low at 30€ in January, it then increased gradually reaching a peak at 124€ in August (a prime summer month), before declining back down to 37€ in December. The same kind of seasonal pattern was observed in 2022, with the RevPAR hitting a high of 141€ in August and a low of 29€ in January.
In 2023, the RevPAR ranged from 37€ in January to 136€ in August, showing the continuation of this seasonal pattern. However, at the end of the year, in December, there was a notable increase, with the RevPAR reaching 86€, higher than the previous year’s December figure of 42€. In January 2024, the RevPAR was 58€, which suggested a continuous increase when compared to the same month in previous years.
The recurring high RevPAR values in the summer months (particularly August) suggest a substantial increase in room revenue during this period, which likely corresponds with the tourism season in the Provence-Alpes-Cote d’Azur region of France.
Read here: How to Calculate RevPAR.
Occupancy Rate Summary

The occupancy rate for the Provence-Alpes-Cote d’Azur region in France displays a clear cyclical trend throughout the data provided, which covers January 2021 to January 2024, indicating fluctuations in short-term rental market performance.
Beginning at 24% in January 2021, it gradually peaks in the summer months, with the highest occupancy rate observed in August – 72% in 2021, 74% in 2022, and further increasing to 74% again in 2023.
Post-summer months, the occupancy rates decrease, hitting their lower point in the winter. This is observed with occupancy rates declining to 30% in December 2021, 34% in December 2022, and 41% in December 2023.
In the early months of each year (January to March), we see a steady increase in occupancy from the winter slump, setting the pace for the next peak in the summer. This consistent pattern indicates a strong seasonality effect in the occupancy rates for the Provence-Alpes-Cote d’Azur region.
It’s also worth noting that over these three years, there has been a slight overall increase in occupancy rates, which could suggest a positive trend in the region’s popularity.
Read here: How to Calculate Occupancy Rate.
Avg. Bookings Summary

The average bookings data for the region of Provence-Alpes-Cote d’Azur in France showed a somewhat consistent trend from January 2021 to January 2024. There seems to be a cyclic pattern throughout this period, with certain months having increased average bookings.
At the start of 2021, the average bookings stood at 1.4, which gradually increased, reaching a peak of 3.0 in May, and then decreased to a low of 1.3 in December 2021.
A similar pattern was observed in 2022, starting with 1.9 in January, peaking at 2.9 in May, and declining to 1.4 by December.
This trend continued in 2023, starting with 2.2 in January, peaking again at 2.6 in April, and maintaining this level through June, after which it declined to 2.0 by the end of the year.
By January 2024, the average bookings again increased to 2.7, showing the continuation of the previous trend.
Overall, it is clear that the average bookings tend to increase towards the middle of the year, specifically around May and June, before declining towards the end of the year. This could potentially suggest a seasonal booking trend, potentially related to holiday periods or other regional factors.
Count of Active Listings Summary
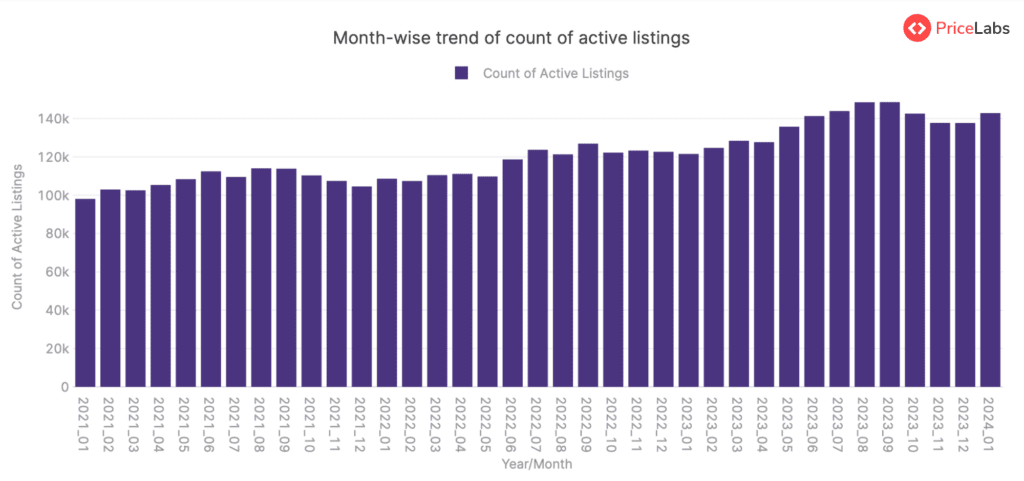
The count of active listings in the Provence-Alpes-Cote d’Azur region of France showed a generally increasing trend from January 2021 to January 2024, indicating growth in the short-term rental market performance in the region. In January 2021, the count was at 98,086, and it gradually increased over the years, hitting a peak at 148,571 listings in September 2023. From that point, it experienced a slight decrease; however, the count of active listings increased again, reaching 142,842 by January 2024. Overall, despite small fluctuations, the data reflects a consistent growth in the number of active listings for this region over the given period.
Get actionable market insights from PriceLabs’ Market Dashboards
About Short-term Rental Index
The World STR (Short-term Rental) Index by PriceLabs is a free tool for tracking short-term rental market performance worldwide. It offers data from Airbnb markets worldwide, refreshed monthly. You can access free insights on which locations are gaining or losing popularity. Key features include:
- Compare: Compare year-over-year metrics like active listings, occupancy rates, RevPAR, and ADR.
- Trend: Visualize how metrics have changed over the past years.
- Pacing: Compare upcoming year metrics to the previous year for occupancy, ADR, and RevPAR.
Explore more FREE tools by PriceLabs here.
About PriceLabs
PriceLabs is a revenue management solution for the short-term rental and hospitality industry, founded in 2014 and headquartered in Chicago, IL. Our platform helps individual hosts and hospitality professionals optimize their pricing and revenue management, adapting to changing market trends and occupancy levels.
With dynamic pricing, automation rules, and customizations, we manage pricing and minimum-stay restrictions for any portfolio size, with prices automatically uploaded to preferred channels such as Airbnb, Vrbo, and 100+ property management and channel integrations.
Every day, we price over 300,000+ listings globally across 135+ countries, offering world-class tools like the Base Price Help and Minimum Stay Recommendation Engine. Choose PriceLabs to increase revenue and streamline pricing and revenue management. Sign up for a free trial at pricelabs.co today.